Sam Dyson’s 2017 Season Isn’t Going Well

Sam Dyson‘s 2017 season isn’t going well so far. Last season, Dyson posted a 2.43 ERA and a 2.9 WAR in 70 innings, giving up just 63 hits and 19 earned runs and earning 38 saves as the closer for the Texas Rangers.
Dyson came into this season looking to lock down his position as the team’s closer and solidify his status as one of the game’s premier late inning revilers. Things have, um, not gone well.
In 4 games over the first week and a half of baseball, Dyson has pitched just 3 innings. He’s faced 22 batters, walked 3 of them, struck out 2, surrendered 11 hits (that’s better than a .500 opponent batting average for those of you scoring at home) and given up 11 runs, all earned. That’s 19 runs in 70 innings last year and 11 runs in 3 innings this year. He has a 33 ERA, a 14 ERA+, and a 4.66 WHIP.
So what’s going on? Obviously, it’s very early yet and it seems unlikely that Dyson will continue to struggle this badly all year. Things will probably normalize. But that doesn’t mean we can’t try to isolate what’s going on with Dyson now and see if we can determine if his rough start is a bump in the road or if his solid 2016 was the fluke.
Let’s start with velocity. Typically, when a pitcher is hurt or there’s something terribly wrong, we see it in speed. According to Fangraphs, Dyson has seen a small drop in velocity. His fastball is one mph slower this season compared to last, 95.8 vs 94.8, and his curve, slider, and change are all almost exactly half a mile per hour slower as well. However, there are a couple of important caveats here.
First, Dyson has only pitched 3 innings this year so maybe the drop in velocity is overblown, but his velocity did trend in the wrong direction last year. On the other hand, a lot has been made this year about a change in the way pitch velocity is tracked. The new technology seems to be adding a mile or two to pitches, so a 1 mph drop on paper for Dyson might actually be closer to 2 or 3 mph in real life. That said, it’s unlikely that even a 3 mph decline could account for the way Dyson has struggled so far.
So what about pitch selection? Maybe those 22 batters have essentially known what’s coming because Dyson scrapped a pitch that ended up being awfully important?
Actually, maybe. Dyson has always been a fastball-changeup guy, only mixing in his curve and slider from time to time. In 2016, he threw about 69% fastballs, about 20% changeups, about 10% curveballs, and about 2% sliders, according to Fangraphs. However, this season that’s been taken to the extreme. In 2017, it’s been more like 75% fastballs, 21% changeups, and barely any curves or sliders.
On the surface then, it does seem possible that hitters are sitting on fastballs, which are not quite as fast as they used to be, getting a lot of them, and not missing. This season, nearly 30% of the batted balls against Dyson have been line drives, up from just 19% last season. At the same time, he’s given up fewer ground balls and more fly balls, including 2 home runs, and more than 52% of balls put in play have been hit to the center of the field, suggesting batters have really timed up Dyson well so far. Not good.
There’s something else going on too, and this, I think, might be a big part of the equation. Below is a chart of Sam Dyson’s pitches by strike zone quadrant for the 2016 season:
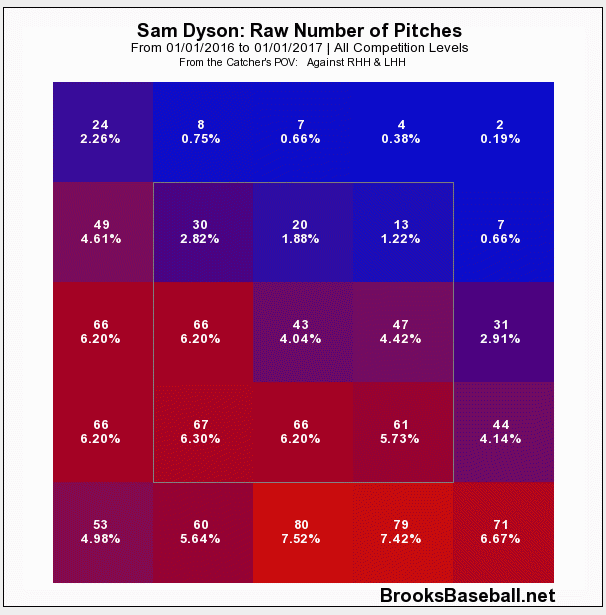 Take a look at the bottom third of the strike zone and the area below it. Dyson lived there. More than 32% of all his pitches in 2016, his best season, were below the zone. He wanted hitters to reach down below the knees and hit ground balls and it worked. Last year, more than 65% of the batted balls against Dyson were hit on the ground, a number pretty much in line with his career average, and most were hit to the pull side, a good sign for a changeup heavy pitcher.
Now, here’s the chart of his 4 outings so far this season:
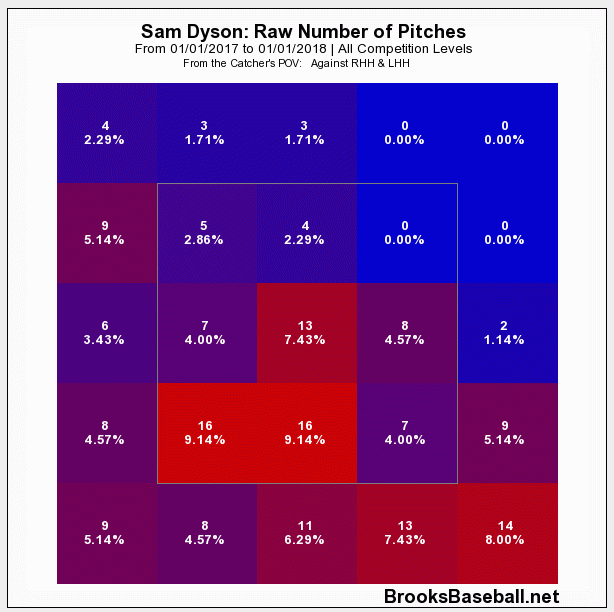
Obviously, it’s a far smaller sample size, but I think it’s instructive. It seems like a significant portion of pitches that were just below the zone last year are squarely in the bottom third of it this year. Instead of living just below the knees, Dyson is throwing balls knee high and out over the plate, a perfect recipe to generate all those line drives. He’s even left nearly 7.5% of his pitches right down the middle.
So, here’s my unified theory of Sam Dyson: This season, Dyson is throwing between 1 and 3 mph slower than last season, he’s not mixing his pitches as well, and, perhaps as a result of overthrowing a little bit to try and get that missing velocity back, he’s missing higher in the zone than he was when he had success.
Sure, it’s a small sample so far and a lot can change but according to Baseball-Reference, Dyson has already cost the Rangers nearly a win. In a competitive division like the AL West, you have to wonder how long they’ll give him to figure things out.
-Max Frankel


