World Series Teams Showcased the Number Two Spot in the Lineup
With World Series MVP Corey Seager hitting bombs for Texas and Corbin Carroll or Ketel Marte using their power and speed to spark the Diamondbacks, this year’s World Series was a showcase for the number two spot in the batting order. The number two spot is where it’s at these days. All the cool teams have their best players hitting second. Well, maybe not all; the Atlanta Braves hit Ronald Acuña Jr. leadoff and he is incredible, but many good teams bat players second who in previous eras would have batted third or fourth.
In addition to Corey Seager, who batted second every time he came to the plate for Texas in the regular season, we saw Freddie Freeman of the Dodgers, Aaron Judge of the Yankees, Alex Bregman of the Astros, Adley Rutschman of the Orioles, Bobby Witt Jr. of the Royals, and Jorge Soler of the Marlins as some of the top hitters on their respective teams who had more than 400 plate appearances in the number two spot.
It makes sense to put a good hitter second in the lineup. In fact, as simple as it sounds, it makes sense to put good hitters in the top three spots in the order because that’s where the most plate appearances are. Over the course of the 2023 season, each spot down the order had an average of 18 fewer plate appearances than the one before it. Many teams have figured this out in recent years and adjusted their lineups accordingly.
It wasn’t always like this. For more than a century, teams routinely put their best hitters third or fourth, the legendary spots of Babe Ruth and Lou Gehrig, who were also given uniform numbers to match their place in the batting lineup. Managers typically wanted a fast guy batting leadoff and a guy who could “handle the bat” hitting second. Ideally, the fast guy would get on base and possibly steal a bag or two. Failing that, the scrappy number two hitter could bunt him over or move him up on a hit-and-run play. Then came the team’s best two hitters with a chance to drive in the run.
This is how it was 100 years ago and how it remained for decade after decade, generation after generation. Babe Ruth batted third or fourth in 95 percent of the games he started. Joe DiMaggio hit third or fourth in 98 percent of his starts. Stan Musial (90%), Willie Mays (84%), Hank Aaron (94%), Willie Stargell (83%), Mike Schmidt (81%), and Ken Griffey Jr. (88%) continued the trend through the 1950s, the 1970s, the 1990s and into the 2000s.
Barry Bonds batted leadoff and fifth early in his career, then moved to third or fourth for the bulk of his games started (65%). Unlike many of today’s top players, Bonds rarely batted second, making just 25 of his 2848 starts in the number two spot. In today’s game, he would very likely hit second, where he would be assured of striking fear in the heart of every pitcher in the first inning of every game.
The shift to getting better hitters higher in the lineup happened over the last dozen or so years.
The following chart shows the wRC+ by batting order position from 2009 to 2023. Found at FanGraphs, wRC+ is a hitting metric that adjusts for league and ballpark effects so players can more easily be compared across seasons and eras. A 100 wRC+ is league average, with anything above 100 being better than league average and below 100 being worse than league average. For example, this year Corey Seager had a 169 wRC+, meaning he was 69 percent better than league average on offense.
The chart below shows wRC+ by lineup spot over the last 15 seasons, with the most productive lineup spot highlighted in green, second-most in yellow, and third-most in blue. It reveals the movement by teams to get more productive hitters in the number two spot beginning around 2014-2015, with another shift in 2019, when number two hitters outhit number three hitters for the first time.
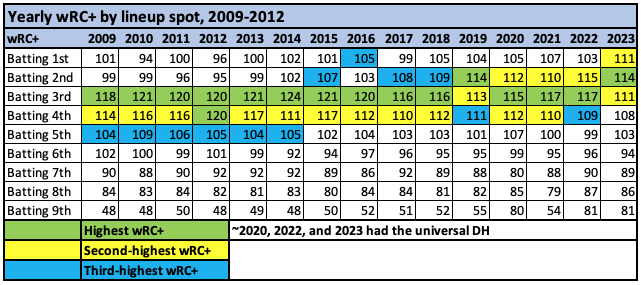
From 2009 to 2013, there were five straight years in which the number two spot finished with a wRC+ from 95 to 99, which is below league average. Hitters in that spot have been above average every year since. From 2014 to 2018, number two hitters had five seasons with a wRC+ from 102 to 109. From 2019 to 2023, they upped their performance to the 110 to 115 range each season. Considering historical trends, it’s likely the 2023 seasons was the first time the top three spots in the lineup had the top three wRC+ marks. It only took 148 years for MLB teams to figure out their best hitters should get the most plate appearances.
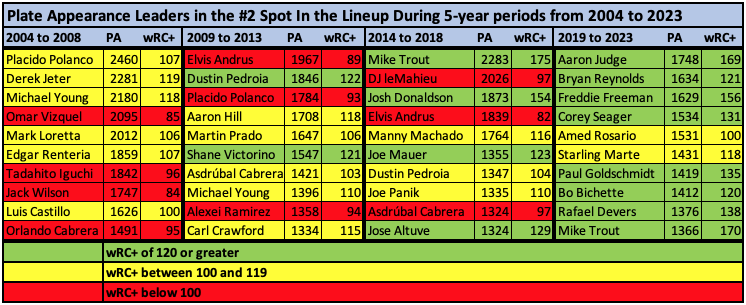
We can put some names to these numbers by looking at the evolution of the number two spot in the lineup over the last 20 years. The chart below shows the top ten players sorted by plate appearances while in the second spot in the lineup, with their wRC+ over each time period. Players shown in green had a wRC+ higher than 120. Players in yellow had a wRC+ from 100 to 119. Players in red had a below-average wRC+.
From 2004 to 2008, there were no hitters among the top ten in plate appearances in the number two spot who achieved a 120 wRC+. Four of the top ten were below-average, with the other six coming in between 100 and 119. Omar Vizquel had over 2000 plate appearances batting second despite his 85 wRC+ while in that spot in the order. Jack Wilson was similarly futile, yet hit near the top of the order on a regular basis. Teams were just giving up outs right and left with hitters coming to the plate directly in front of their best bats.
There is improvement in the 2009 to 2013 range, with a couple of players—Dustin Pedroia and Shane Victorino—topping the 120 wRC+ mark while getting significant playing time in the number two spot. Unfortunately, there were also Elvis Andrus, Placido Polanco, and Alexie Ramirez and their below-average hitting wasting too many at-bats in a prime lineup spot.
From 2014 to 2018, we begin to see the transformation, with power hitters Mike Trout and Josh Donaldson appearing on the list. They were the canaries in the coal mine. Trout hit leadoff in all of his starts in his first full season in 2012, then was shifted down the lineup in 2013, making 57 percent of his starts in the number two spot, 32 percent in the number three spot and 11 percent batting leadoff. In 2014, the transformation was complete, as he started 155 of his 157 games in the second spot. That was the same year that Josh Donaldson started hitting second regularly.
From 2019 to 2023, the leaderboard for plate appearances by number two hitters is filled with elite hitters, including Aaron Judge, Freddie Freeman, Corey Seager, Paul Goldschmidt, Rafael Devers, and Mike Trout, all of whom were well above average in wRC+. At 118, Starling Marte just missed the 120 wRC+ cut. The outlier is Amed Rosario and his perfectly average 100 wRC+.
Considering the players show above, it’s not surprising that number two hitters have improved in both on-base percentage and slugging percentage. Teams have moved their best hitters up in the lineup and top hitters have good on-base skills and hit for power. That being said, there appears to be a decided emphasis on hitting for power in the number two spot in recent years. The chart below shows how the number two spot in the lineup compared to the MLB average in on-base percentage, slugging percentage, and isolated power (slugging percentage minus batting average) from 2013 to 2023.
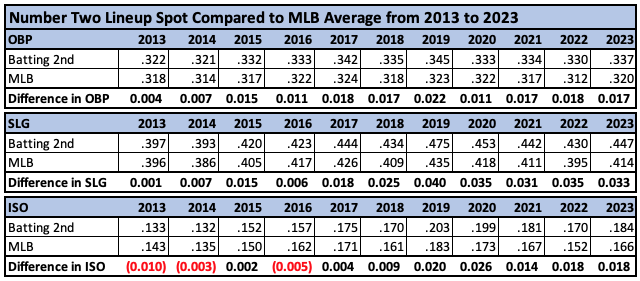
The 2015 season saw a big jump in teams getting better on-base production from the number two spots, while the 2019 season appears to be a dividing line for power hitters, with number two hitters significantly improving their slugging percentage and isolated power from previous seasons. This was also the big “year of the home run,” but number two hitters have continued to hit for more power than their predecessors even as fewer home runs have been hit overall the last few seasons.
Now that we’ve had a good stretch of seasons with great hitters batting second, it seems ridiculous that it took so long. The last time the Texas Rangers were in the World Series was 2011. Their number two hitter that year was also a shortstop. It was Elvis Andrus, who hit .274/.343/.358, with five home runs and a 91 wRC+ when batting second. This year, it was Corey Seager, who hit .327/.390/.623, with 33 home runs and a 169 wRC+. What a difference a dozen years makes.


