Baltimore Orioles Euphoria
What is happening in Baltimore? In the preseason, ESPN projected the Baltimore Orioles to finish 58-104, which was an improvement over last year’s 52-110 record, but still the worst projected record in baseball. ESPN’s most optimistic “if everything goes right” projection was for 70 wins. At FanGraphs, the Orioles were projected to go 63-99, which was also the lowest projected win total for any team. Vegas had the O’s over/under at 62.5, once again the lowest projected over/under of all 30 MLB teams.
Yet, through games on Friday, August 19 the Orioles had already exceeded the 58 wins that ESPN projected in the preseason. They were five games over .500, and just a 1.5 games out of a wild card spot. And it’s not like they’re doing it with smoke-and-mirrors. Last season, the Seattle Mariners finished 90-72 despite a -51 run-differential. Their expected win-loss record was 75-87. That was a smoke-and-mirrors season. This year’s Orioles have a +10 run-differential and an expected record of 56-55, which is just slightly worse than their actual record. They’re mostly legit.
How is this possible? And how excited should we be? Even though I’m not a longtime Baltimore Orioles fan, I’m rooting for them anyway because of how far they’ve come since last season and the difficult division they play in, where four of the five teams are above .500 (and the Red Sox are just two games under). If the season were to end today, the AL East would have three of the six playoff teams in the American League. Only the spunky Seattle Mariners (legitimately good now) are preventing them from having four of six.
When we break the team down into offense, starting pitching, relief pitching, and defense, the biggest improvement has been in the bullpen, from slightly worse than league average last year to among the best in baseball this year. The offense is better than last year, but still below league average. The starting pitchers have moved from near the bottom of baseball to near the middle (based on FanGraphs WAR). And the defense has either greatly improved or moderately improved, depending on the metric used to judge such things.
Moving the Fences
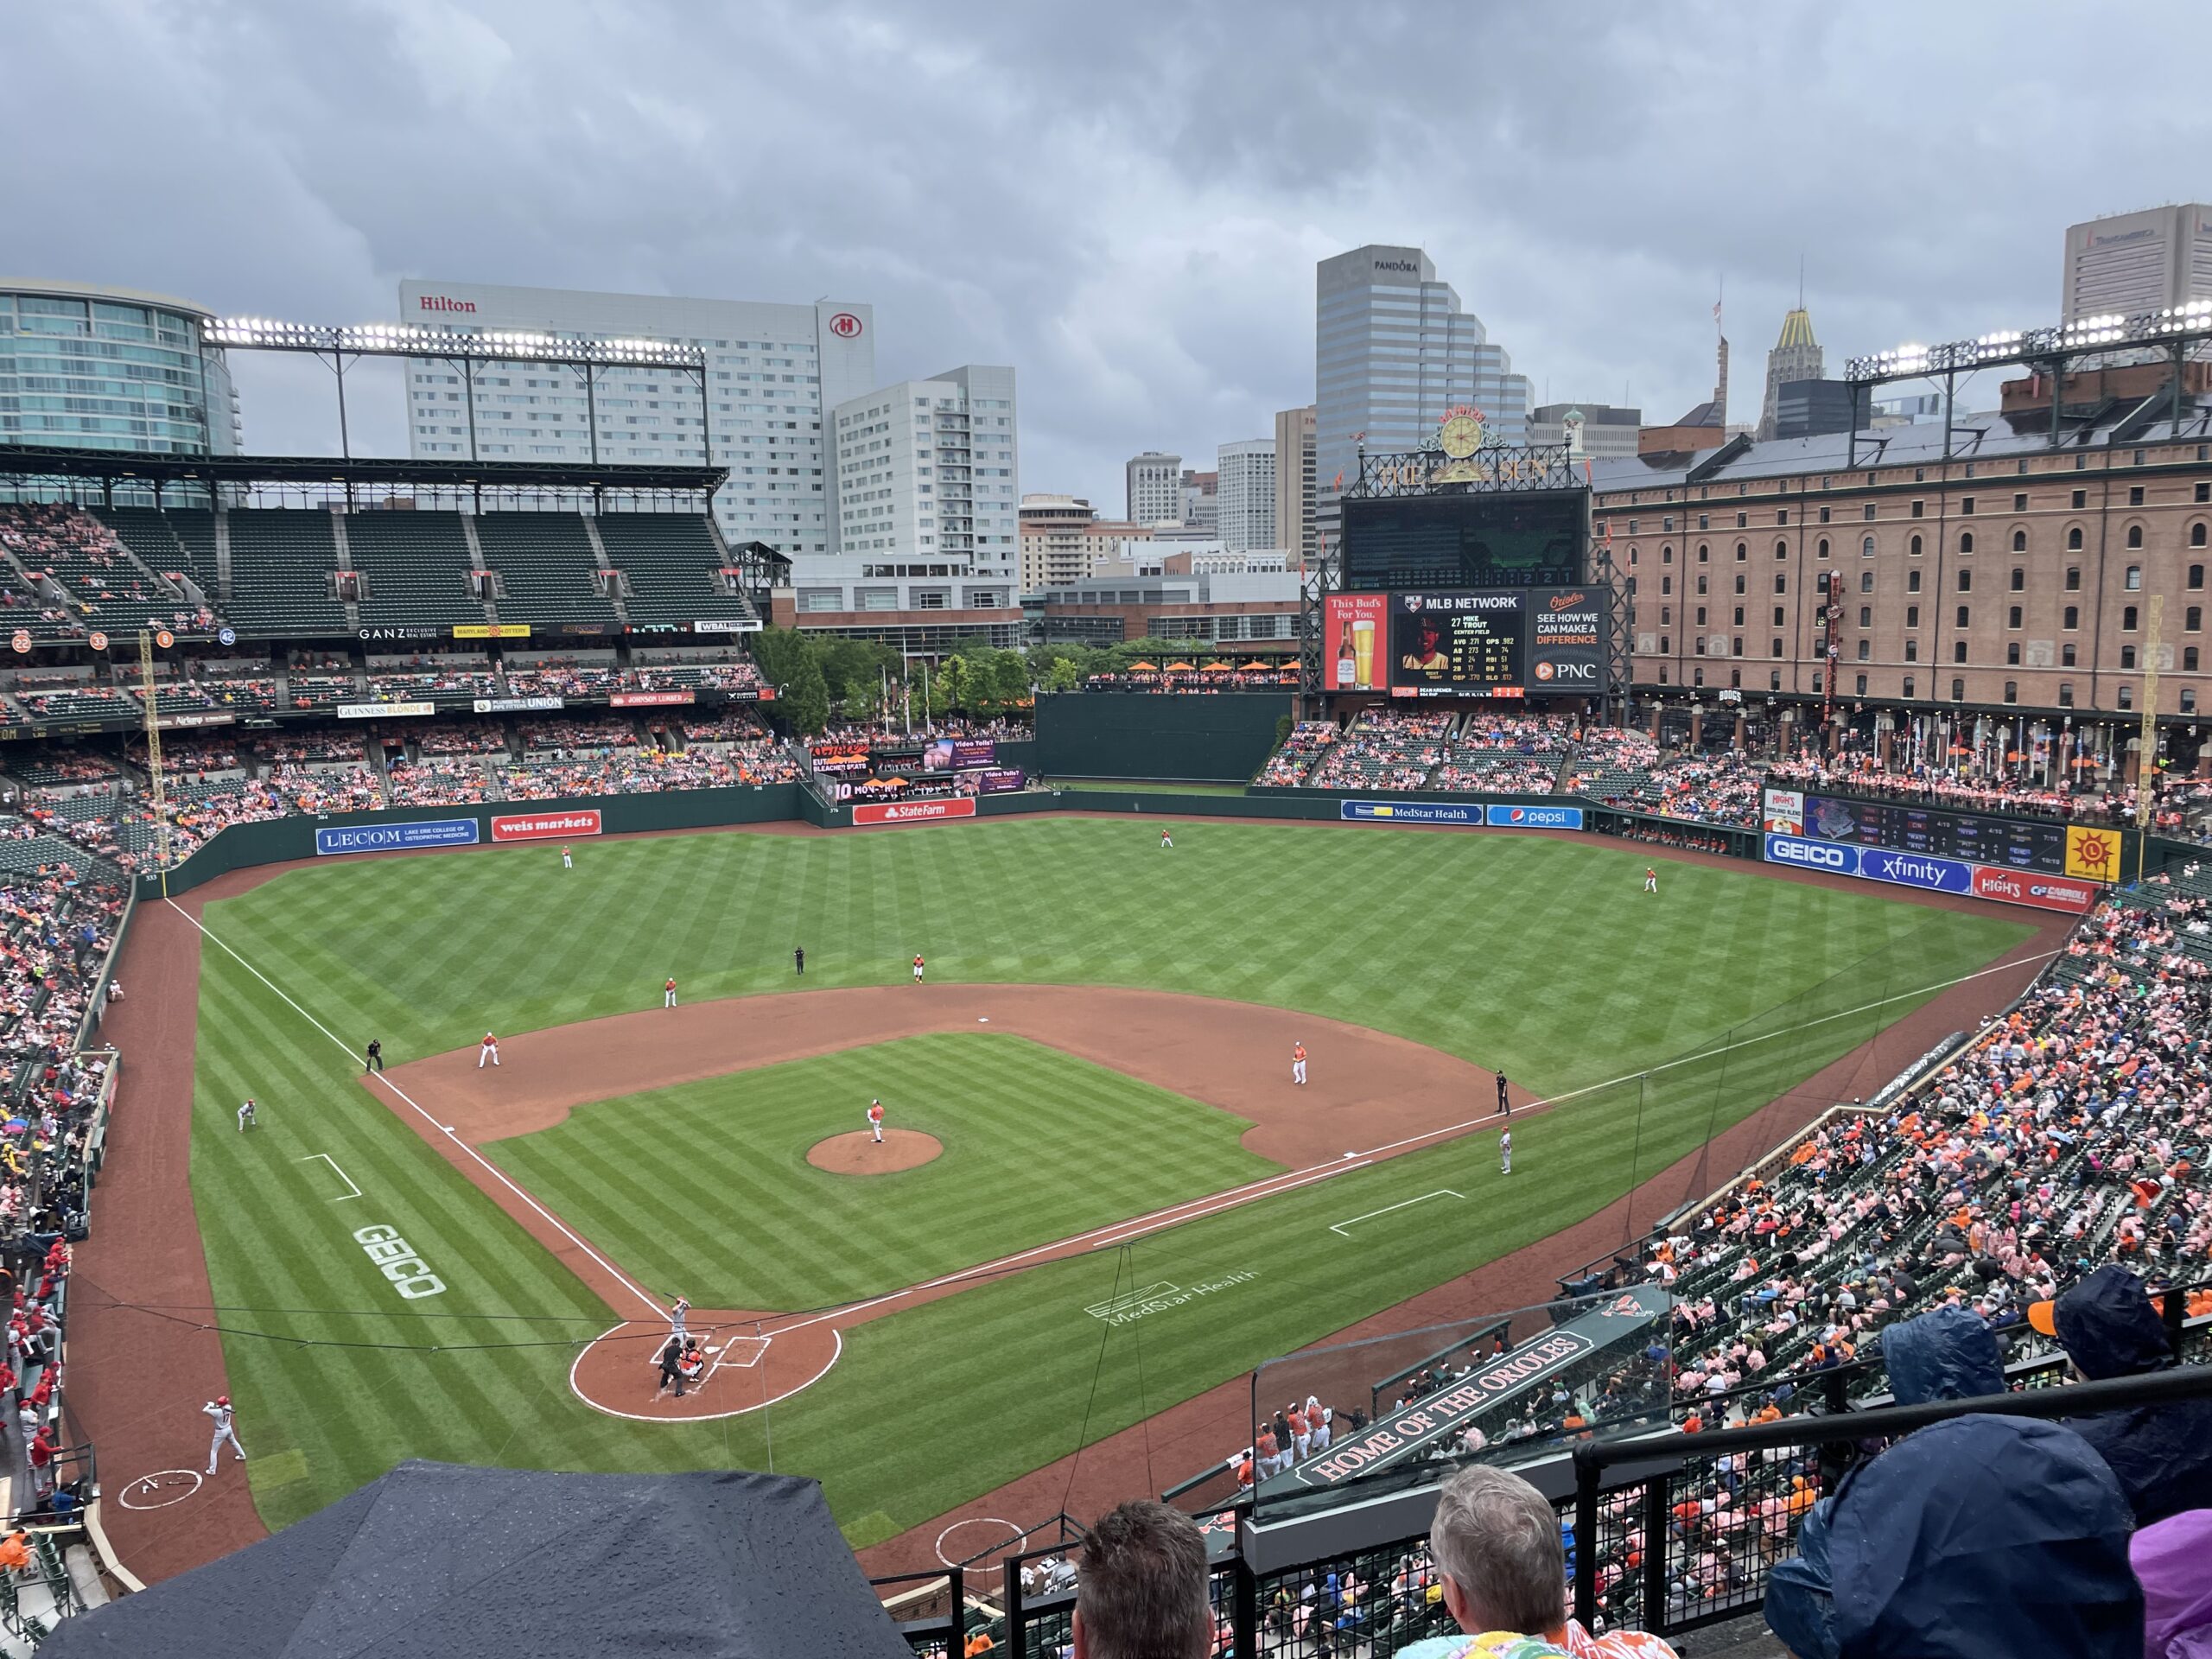
Of course, there’s another prominent reason the team’s fortunes have changed so much in just one season. The ballpark. One of the big offseason stories in Baltimore was the team altering the dimensions of Oriole Park at Camden yards. Specifically, the left-field wall was pushed back 26.5 feet and raised from 7-feet-4 inches to 13 feet. We don’t yet have even one season of data, but the early returns are very interesting. Let’s start with the hitters:
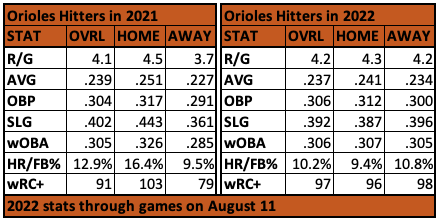
In 2021, Orioles hitters took advantage of their hitter-friendly ballpark to score runs at a higher rate, get on base much more often, and hit for more power when playing in Baltimore. Specific to the offseason move of the left-field fence, the Orioles rate of home runs per fly ball at home was 16.4 percent, which was 6th in baseball. On the road, just 9.5 percent of their fly balls left the yard, which ranked 25th. They scored 0.8 more runs per game at home than on the road and had a 103 wRC+ at home (12th in MLB) versus a 79 wRC+ on the road (26th).
The hitting stats are much more even this year, with a similar runs per game and wRC+ at home versus on the road. As you’d expect, their home run rate is down dramatically at home compared to last year, and is actually lower than their home run rate on the road. Despite the dramatic drop in home run rate at home, they’re scoring is down just 0.2 runs per game at Oriole Park from 2021 and is up by 0.5 runs per game away from Baltimore. They’re just a much more balanced team now, without the wild swings they had last year.
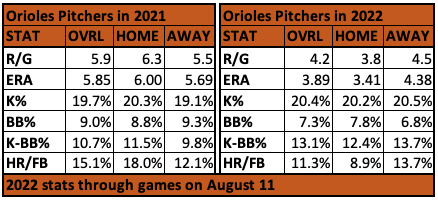
While Orioles hitters may not be happy about the ballpark change, the team’s pitchers must love it. The team’s overall 5.85 ERA in 2021 was the third-highest ERA for any MLB team in the Expansion Era (1947-present). Only the 1996 Detroit Tigers (6.38 ERA) and 1999 Colorado Rockies (6.03 ERA) were worse. This year, their ERA is down by almost two runs, to 3.89. It’s quite amazing, really.
The 2021 staff was particularly bad at keeping the ball in the ballpark. Overall, they allowed 1.7 home runs per nine innings, which is the second-highest rate of homers allowed in the Expansion Era. The only team worse is the 2019 Baltimore Orioles, at 1.9 HR/9 IP. Additionally, as the chart above shows, they were particularly bad at home, where 18 percent of their fly balls allowed went over the fence compared to 12.1 percent on the road. No team allowed a greater rate of home runs per fly ball than the 2021 Orioles.
The 2022 Orioles, on the other hand, have allowed just 8.9 percent of fly balls to go for home runs when playing at home, which is the 4th-best home mark in the big leagues. This improvement at home, from 30th in baseball in HR/FB to 4th is a major factor in their pitching success this year. With the home run rate coming down so significantly, the team’s ERA has dropped from 6.00 at home last year to 3.41 at home this year.
Another reason the team’s pitching has improved is a lower walk rate, both at home and on the road. This is particularly true for their road games, where they’ve actually allowed more home runs per fly ball (13.7% HR/FB this year versus 12.1% HR/FB last year), but have countered that with an increase in strikeout rate (19.1 percent to 20.5 percent) and a significant reduction in walk rate (9.3 percent to 6.8 percent).
Better Defense
In addition to their brutal pitching, the 2021 Orioles were bad on defense, ranking 26th in the FanGraphs defensive metric and 28th in Statcast Outs Above Average (-32 OAA). This year’s team ranks 10th at FanGraphs and 20th in Outs Above Average (-6 OAA). That change in Outs Above Average not seem like a significant move up the ranks, from 28th last year to 20th this year, but a closer look at how their season has played out shows that they were quite bad in April, ranking 26th in baseball with -8 OAA, and have been better since. One of the key differences from last year to this year is the improvement from the left-side infield combination of Jorge Mateo at shortstop and Ramón Urías at third. Also, catcher Adley Rutschman has been a big upgrade over Robinson Chirinos in FanGraphs’ framing metric.
Where Do They Go From Here?
The cold-hearted, analytical point-of-view can best be shown by this postseason playoff odds graph at FanGraphs (through games on August 11):
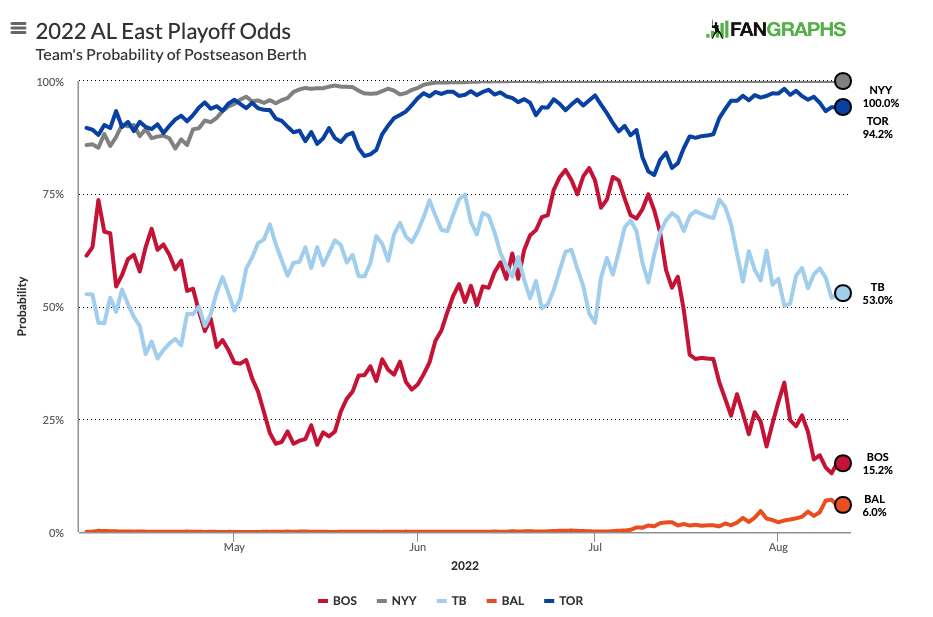
Despite how far they’ve come this year, a realistic view of the Orioles’ prospects for the rest of the season gives them about a six percent chance to make the playoffs, which is lower than every team in their division AND five other teams in the American League (Astros, Guardians, Mariners, Twins, White Sox). This is partly due to the Orioles having the most difficult remaining schedule in the AL. It kicks off this weekend with three games in Tampa Bay followed by three in Toronto, both teams just above them in the wild card standings. They also have a stretch of 12 games from August 19 through September 1 against the Red Sox, White Sox, Astros, and Guardians.
This is why the team traded away Trey Mancini and Jorge Lopez, two players who would improve their chances to make the playoffs this year, but who were dealt away for players who will help them in the future, when their odds to make the playoffs are likely to be better. At the trade deadline, the Orioles front office took a realistic look at the 2022 team and decided to focus more on 2023 and 2024.
FanGraphs now projects the Orioles to win 79 games, which is a major improvement for a team that won just 52 games last year, but it would still leave them short of a magical playoff appearance. Of course, projections aren’t prophesy. We don’t know what will happen. We do know there’s a little less than one-third of the season left and the Orioles are a half-game out of a playoff spot, with their next six games against two of the three wild card teams. I’d love to see what another week of Orioles magic would do to those playoff odds.


