Curious Case of Jake Arrieta’s 2016 Pitching Mechanics
Jake Arrieta of the Chicago Cubs went through some rough patches in 2016. A loss of command to batters in the middle of pitching sequences led to a noticeable uptick in walks. This issue compounded itself and lead to a potential shift in confidence that correlated with overcompensation. Let’s dive into the numbers over his career to see if 2016 was a return to prior form, leaving 2014 and 2015 as the best we will ever see of Jake Arrieta.
This is a guest post from friend of the blog Ricky Mears, who writes over at Innings Pitched. Their website will be launching in January 2017. Follow @InningsPitched on Twitter to stay up to date before the launch and sign up for the Newsletter. Tickets to a MLB or MiILB will be given away to a follower once they reach the 200 threshold.
By The Numbers
Jake Arrieta was lauded as having pinpoint control in 2014 and 2015. His 2.08 walks per nine innings placed him as number 24 out of 84 qualifying starting pitchers over the two year stretch. In 2014, Arrieta had 8.2% walk rate against lefties and a 5.4% walk rate against righties. Similarly, in 2015 he had a 6.6% walk rate against lefties versus a 4.6% versus righties.
The trouble came in 2016 when the walk rate against lefties skyrocketed to 13.6% and walk rates against righties increased to 5.9%. The graph below depicts walks per nine (BB/9) over the course of his career, which follows an identical pattern as the walk rate percentage described above.
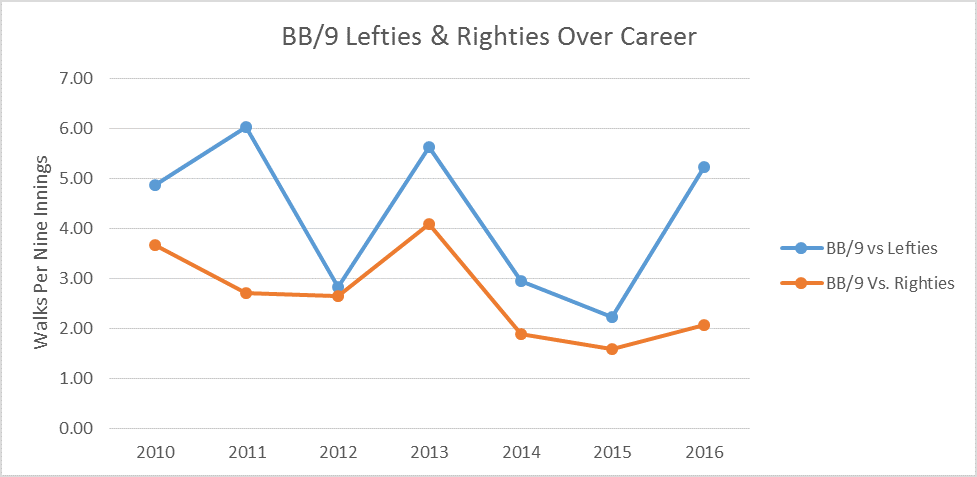
Jake Arrieta was with the Baltimore Orioles from 2010 through the 2013 season and his first season with the Chicago Cubs was 2014. His career average walk rate versus lefties is 4.25 per nine innings versus 2.66 versus righties. Compare this to his 2016 campaign: 5.17 BB/9 versus lefties and 3.25 versus righties. So, Jake Arrieta, did not necessarily fall off a table in 2016, he just regressed to his pre-Chicago Cub ways (at least in terms of control). Lefties are clearly giving Arrieta fits, so let’s dive in and see the numbers and pitching mechanics that could be causing the issue.
Examining Pitch Velocity and Spin Rates
Jake Arrieta’s primary off-speed pitch in 2014 and 2015 was his slider (SL in graph below). He also mixed in a curveball and the occasional changeup to keep the hitter honest.
Innings Pitched will focus mainly on the slider and his fastball. These two offerings appeared to be Jake Arrieta’s achille’s heel in 2016. His fastball sat at an average 93.6 mph in 2016, compared to 94.4 mph in 2015 (0.8 net decrease). Similarly, his slider sat at 89.2 mph in 2016, compared to 90.3 mph in 2015 (1.1 mph net decrease).
The decreased fastball and slider velocity is troubling, as this gives the hitter more time to react. Additionally, a decrease in slider velocity also tends to correlate with a decrease in spin rate. The spin rate of the ball has an effect on the horizontal movement of the ball and can lead to decreased exit velocities off the bat (confirmed in small sample sizes). Generally speaking, Revolutions Per Minute (RPM) above 2000 for a slider is considered slightly above league average with 2500 as near elite.
Do not take my word for this, let us consult Baseball Savant, the statistics database us stat nerds all love.
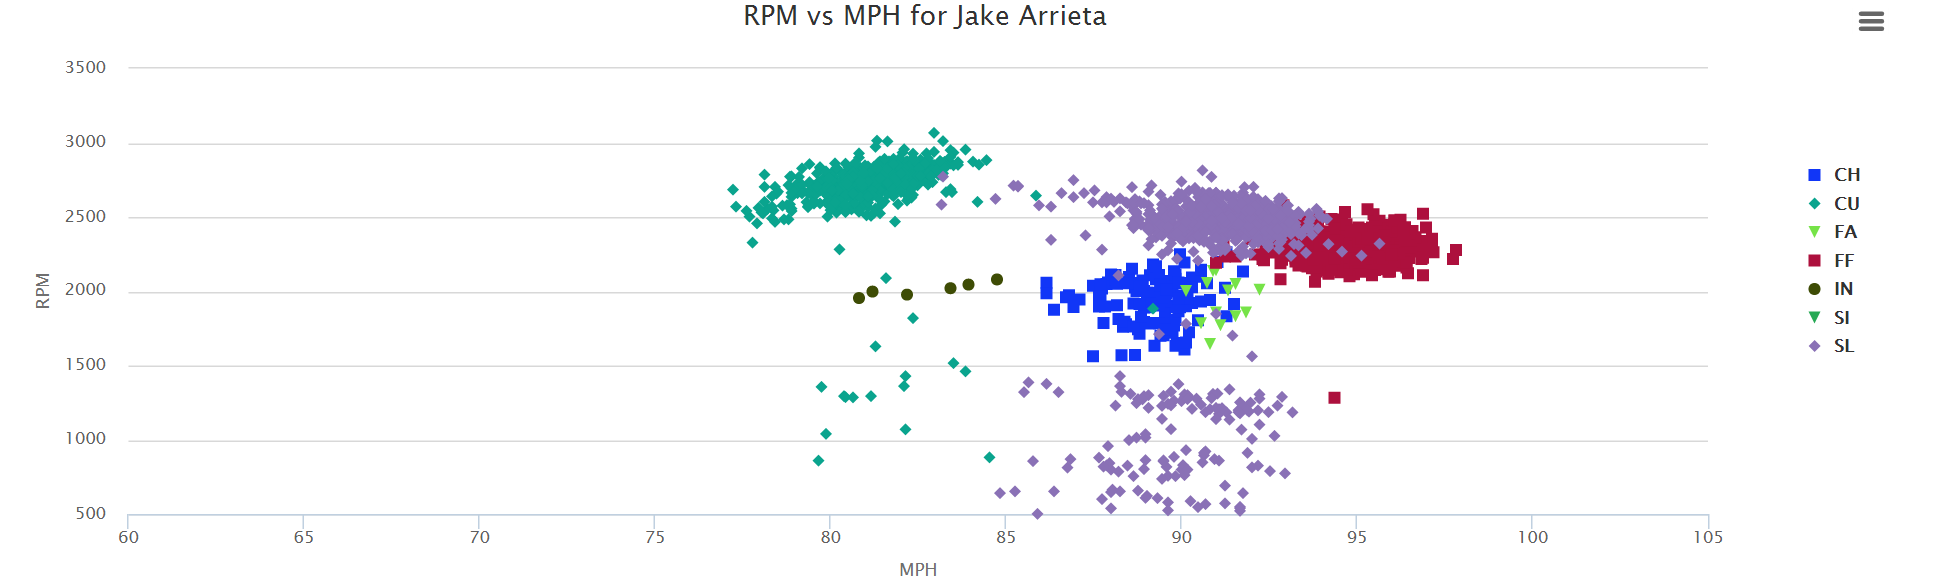
2015 RPM vs MPH Graph via Baseball Savant
Jake Arrieta threw 3,438 pitches in 2015. 989 of which were sliders (28.8%). The 989 sliders thrown was good for seventh in league, behind Yovani Gallardo and ahead of Francisco Liriano. Of those 989 sliders thrown, 608 had a spin rate of 2,000 rpm or greater. Accordingly, this means that 608 of 989 sliders (61.4%) were above league average. You can also note that the relative nucleus of the slider in the plot (in purple) is to right of the 90 mph mark.
Now take a look at Jake Arrieta’s slider breakdown for 2016, for some astonishing results.
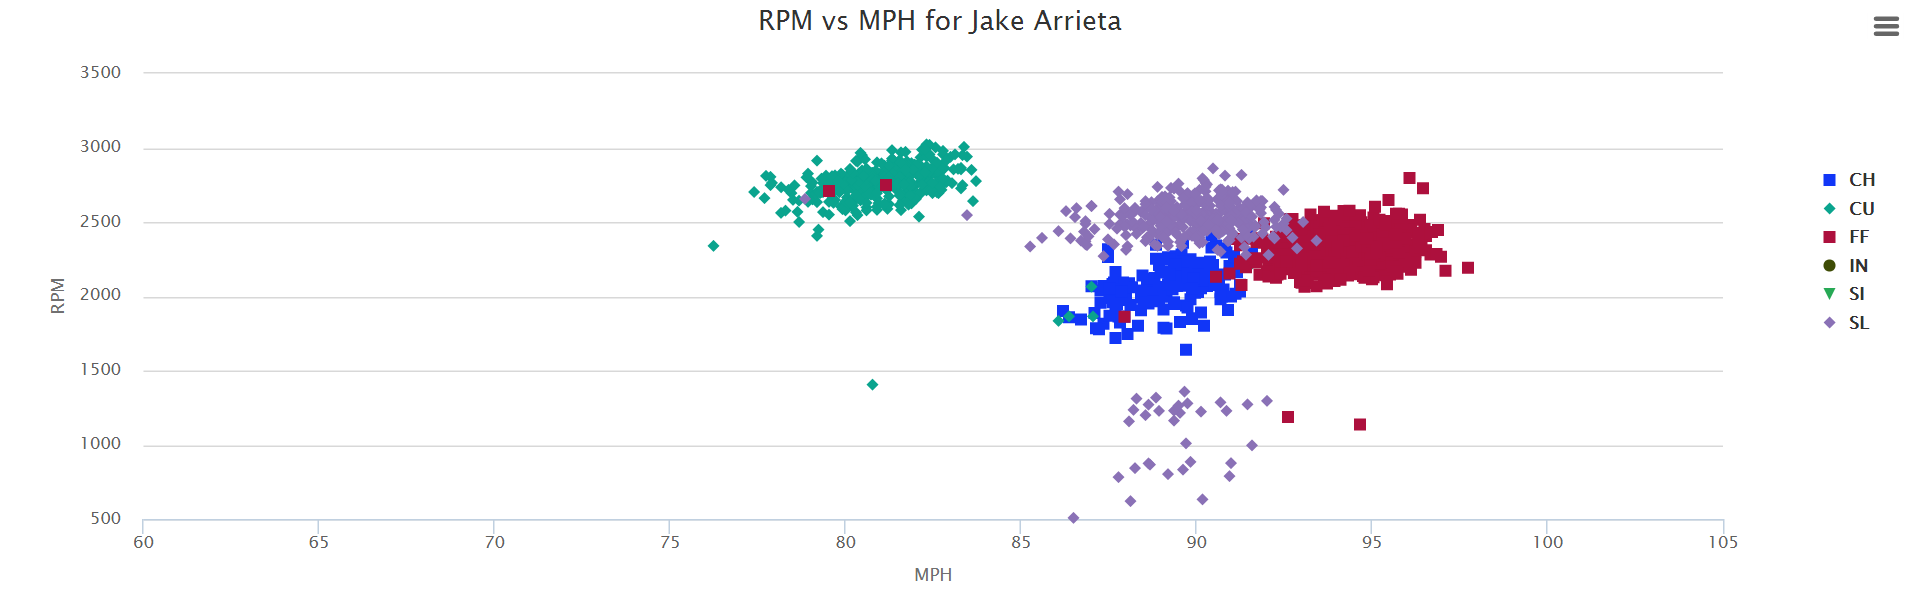
2016 RPM vs MPH for Jake Arrieta via Baseball Savant
Jake Arrieta threw 3,124 pitches, 561 of which were sliders in 2016 (17.8%), down from 28.8% in 2015. The 561 sliders thrown was good for 42nd in the league, down from 7th in 2015. Of those 561 sliders thrown, 337 had a spin rate of 2,000 rpm or greater. Accordingly, this means that 337 of 561 sliders (60.0%) were above league average, compared to 61.4% the year before. You can also note that the relative nucleus of the slider plot (in purple) is to left of the 90 mph mark, compared to the right of the 90 mph in 2015.
At this point you may be like, seriously… Ricky, how am I supposed to follow all those numbers. Here’s an easy to handle bulleted list:
- 2015: 28.8% of pitches were sliders
- 2016: 17.8% of pitchers were sliders
- 2015: 989 sliders thrown were 7th most in league
- 2016: 561 sliders thrown were 42nd in the league
- 2015: 61.4% of sliders had greater than 2,000 rpm and were greater than league average
- 2016: 60.0% of sliders had greater than 2,000 rpm and were greater than league average
In summary of this section, Arrieta utilized his slider 10% less in 2016 compared to 2015, dropping him from 7th to 49th in the league for usage. His 1.4% drop in sliders greater than 2,000 rpm is statistically insignificant. So, if the spin rate was still there at almost the same rate, why did he chose to stop throwing the pitch as frequently?
Trouble Spotting the Slider, Leading to Decreased Confidence?
Jake Arrieta was a pinpoint artist in 2015. His slider painted the corner. He often buckled left handed hitter’s knees. Looking at the image below and to the left, you can see the beauty of a pitch at its finest. Few balls were thrown utilizing the slider in 2015.
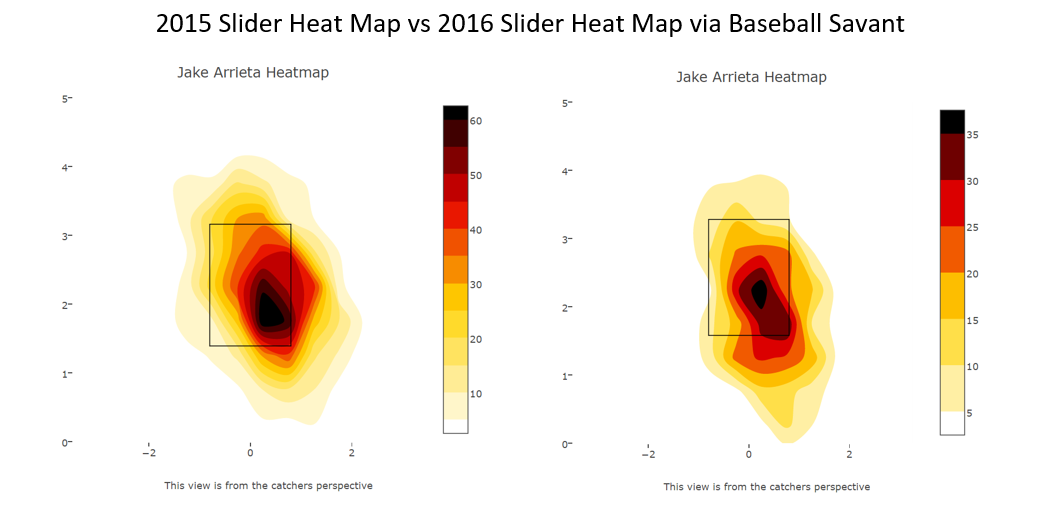
The 2016 slider heat map tells a drastically different story. The slider is not closely packed at the edge of the strike zone. Nearly one-third of the pitches are outside of the strike zone. The ones that missed are low and generally easy for hitters to resist. Hitters, primarily lefties, simply laid offer the slider, and waited for his fastball.
Arrieta could not spot the slider in 2016. He then likely tried to compensate with mechanical tweaks (more on that below). The change in pitching mechanics led to a diminished velocity and loss in confidence. The spin rate was still there, but hitters were simply being patient. Either he had to throw the pitch over the plate or they (primarily lefties) would draw a walk.
Pitching Mechanics
Jake Arrieta is known as a cross-body pitcher. This means that his front foot lands to the right of his starting position. The body then has to laterally compensate with aggressive counter-rotation of the hips. These pitching mechanics add deception, but often correlate with a pitcher losing their release point. Innings Pitched analyzed cross-body mechanics at length in a recent article about David Price. Let’s examine some still photos.
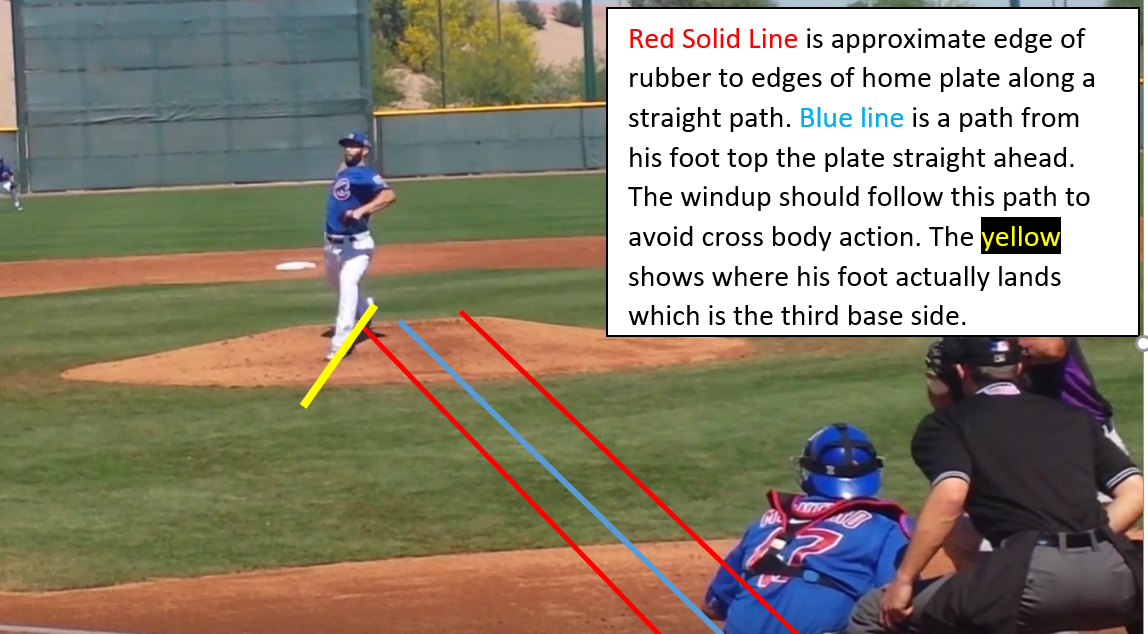
You can see his front foot trailing off the mound to the third base side. This increases deception to right-handed batters. This ball looks like it is thrown right at them and then breaks towards the plate at the last minute. On the flip side, it gives lefties a fraction of a second more to track the pitch. This is evident by the reduce perceived velocity for left handed batters compared to their righty counterparts.
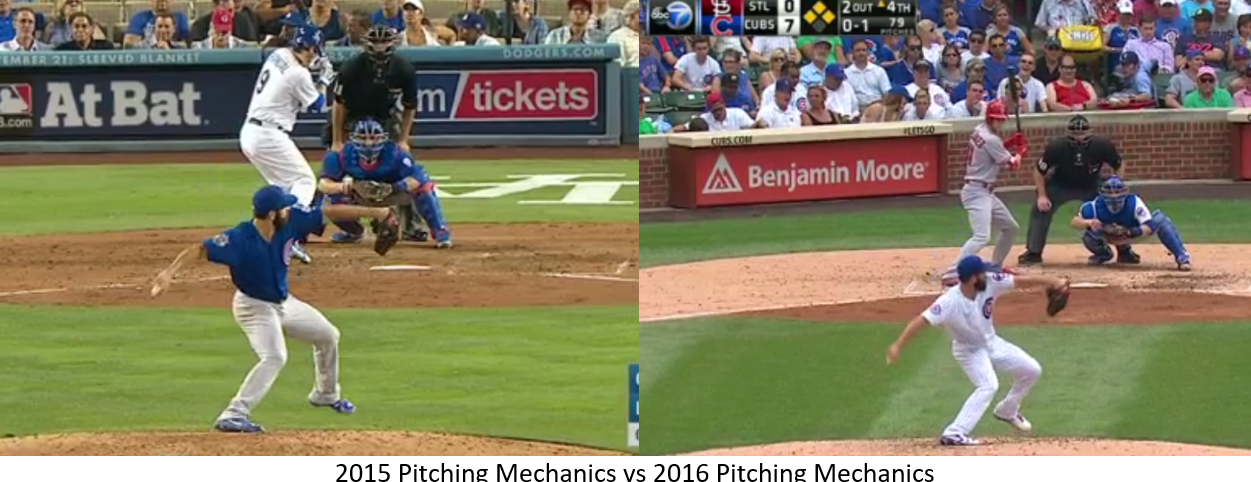
Let’s take a look at his mechanics from 2015 versus 2016.
The 2015 still on the left shows Jake Arrieta standing tall. His back leg is vertical, his head is over his core, and core positioned over his hips. All elements are aligned. However, in 2016, his back is bent, creating a slight forward lean. The lean can force the body and arm action to overcompensate in the wind-up. Overcompensation is an effort to maintain timing and release point. This is evident in the next set photos below.
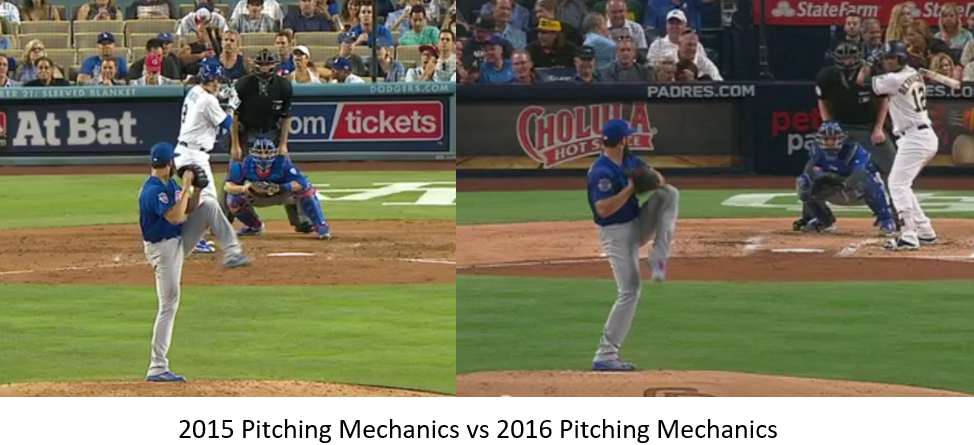
These two photos are snapshots at the same point in Jake Arrieta’s path towards the plate. His right arm extension on the left is angled with a break at the elbow. The right hand is also slightly above the hip compared to the 2016 photo on the right.
The change in height has a compounding effect on the pitcher. Often times the pitcher will have a hard time consistently releasing the ball at the same location. Muscle memory is important, but a minor change in arm height will alter the arm path.
Now let’s examine Jake Arrieta’s release points from 2015 compared to those in 2016.
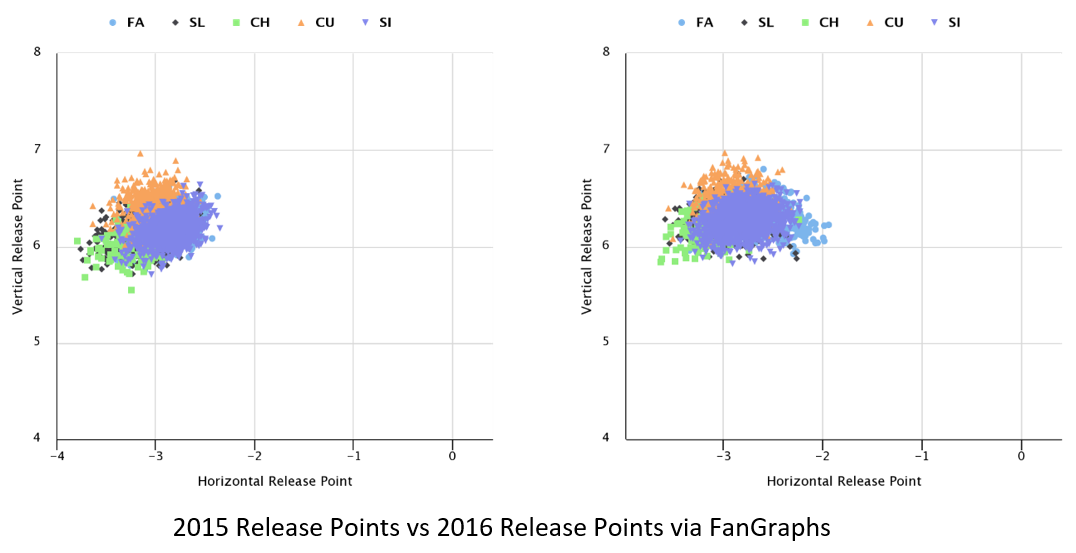
Focus on the slider release points (in purple). Notice a trend that pulls all the information from the article together?
If you did, reach out to us at RickyMears@InningsPitched.com, because you should be writing for us. If not, Innings Pitched will break it down.
The release point of the slider in 2015 is tightly grouped between -3.1 and 2.5 (horizontally) and 6 and 6.5 vertically. The release point of the slider in 2016 is not as tightly grouped. Horizontally from -3.25 to -2.25 and vertically from 6 to 6.75. The total change is approximately 0.40 horizontally and 0.25 vertically.
This may seem inconsequential, but the large spread in 2016 release points show why Jake Arrieta could not spot his slider. The variance in pitching mechanics shows why the release point was changing. The lack of confidence in spotting the pitch led to diminished use, which led to an uptick in walks.
These issues were the same ones that continually affected Jake Arrieta’s performance with the Baltimore Orioles. His saving grace with the Chicago Cubs is that he learned to pitch versus throw.
Arrieta has crafted an arsenal and escapes jams with a thorough knowledge of the game. However, his 7.3 Wins-Above-Replacement (WAR) in 2015 might be a bit of an anomaly. We at Innings Pitched think he will hover around 4 to 5 WAR for the 2017 season.
Putting it all together, if anybody ever told you pitching was easy, we at Innings Pitched have your counterargument here. They call baseball a game of inches for a reason.
This is a guest post from friend of the blog Ricky Mears, who writes over at Innings Pitched. Their website will be launching in January 2017. Follow @InningsPitched on Twitter to stay up to date before the launch and sign up for the Newsletter. Tickets to a MLB or MILB will be given away to a follower once we reach 200.


