 Sorry for the delay in this week’s post, I was moving into a new house all weekend and didn’t get internet till today. Additionally, next weekend I will be away for a wedding, so readers will have to survive without my weekly insight.
Yesterday the Baltimore Orioles tied the New York Yankees for first place in the AL East, knotting them with both New York and Oakland for the second best record in the AL at 76-59. There has been a lot of talk about the Orioles being lucky and not actually being a good team. Most of that talk stems form the juxtaposition of their nearly-immaculate record in close games, with their negative 19 run differential. According to Bill James’ Pythagorean win percentage, this should leave them at a record of 66-69, a difference of 10 wins–which is a differential twice as great as the next largest discrepancy between Pythagorean vs. Actual win total. That mark is shared by five teams: the Red Sox, Reds, Astros, Giants and the Indians. Two of these teams, the Red Sox and Astros, have lost more games than they should have, and the other three have won more than they should have, at least according to the Pythagorean Winning Percentage. Most of the other teams in the league are +/- two wins of their Pythagorean calculation.
What does this mean? Does it mean that the Orioles are incredibly lucky, while the Giants, Indians, and Reds are just regularly lucky, and that the Sox and ‘Stros are unlucky? Or is there something more to it than that? I have a theory–and it is only that, a theory–but I developed it throughout a long playing career in college, high school, and whatever came beforehand.
Managers affect the game in small ways; the overall success of a team relies on the players who play and the players who don’t. Obviously the coaches choose who those players are, but besides that they have little control over the outcome of individual games. However, in close games, those decided by one run or maybe two at certain levels of competition, (more runs are scored per game in college than in the MLB), the coach can have a greater impact on individual game outcomes. Decisions on who to pitch, when to steal and bunt, and when to pinch hit, have a greater impact on games when they are close than when they are not. I can look back through my career and recall close losses and close wins, and the better memories (winning ones) are usually with the coaches that I thought were better and those whose knowledge of the game I respected more. Now I do not have stats from my career before college, so this is all based off of the eye test. Here is how I came to my hypothesis.
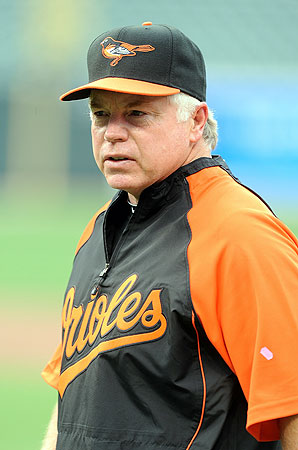
So let’s eye test the managers for the previously mentioned six teams. Buck Showalter for the Orioles is a well-respected manager, has an overall winning percentage of .513, has won manager of the year twice, and has been top four five other times in a 14 season career with the Yankees, Diamondbacks, Rangers, and Orioles. Zero Pennants.
Bobby Valentine is well respected but is in a very bad situation with the Red Sox. The players don’t like him, the fans don’t like him, and he is coming in after the Chicken-and-Beer Fiasco. He has a career winning percentage of .507 and has been in the top seven for manager of the year seven times, but only once higher than fourth (second in 1986). One pennant.
Dusty Baker is a very well respected manager and has seen some success with his current team. His overall winning percentage is .524 and has won manager of the year three times, garnering nine other top eight finishes. One Pennant.
Brad Mills is/was the Astros manager until a few weeks ago. (Don’t worry, I didn’t know him either.) He has managed a total of two and a half years, with an overall winning percentage of .384 and got sixth in the manager of the year voting in 2010 for a 76-86 season. The interim manager, Tony Defrancesco, is 3-12 in his career, but is managing this year’s Astros so we can’t make any judgments on him. Zero pennants between the two of them.
Bruce Bochy is considered to be a quality manager and has had great success with his current team, but never been considered a top tier guy. He has a career winning percentage of (two wins over) .500 in 2872 games, won manager of the year once, and has been top seven a respectable nine other times. Two pennants and one WS title.
Manny Acta is not considered to be a top tier manager, has never had a winning season and has a career winning percentage of .420, he has finished in the top 5 for manager of the year twice, never higher than 4th. Zero Pennants
The hypothesis has been tested–although not thoroughly–throughout history, and what results do we get? We can’t really make any conclusions, but what we might be able to say resembles this: If we were to look at the six managers we just listed, ask people which managers would have worse records compared to their Pythagorean estimates and which managers would have better records, most everybody would have chosen correctly on 5 out of 6 of those managers. Though that survey has not actually been taken, I am confident in my prognosticated results, and look into exploring this theory more in the future.
-David Ringold
Stat of the Day: The last time the Orioles finished a season in first place was 1997.


