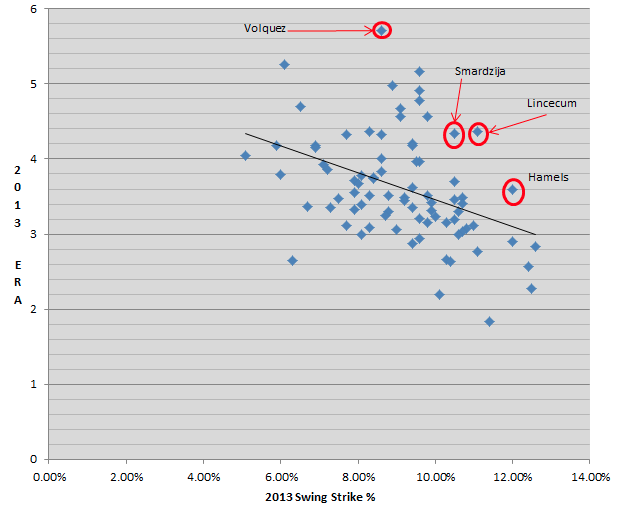
The San Francisco Giants agreed to pay Tim Lincecum $35 Million over the next two season despite his apparent loss of stuff and his 10-14 record, and 4.37 ERA last year. The Philadelphia Phillies still owe Cole Hamels over $100 Million through 2018 and his deal is not seen as a terrible albatross despite putting together a 8-14 record in 2013. Jeff Smardzija is considered to be one step away from making the leap into “Ace” territory and the Chicago Cubs have been attempting to lock him up long term despite his posting a combined 17-26 record and a 4.12 ERA over the last two seasons. Why are all three of these young starting pitchers so highly thought of in the face of their recent struggles?
I did not initially set out to find the answer to that question. In another of those unexpected discoveries that could change mankind (think chocolate bar in the pocket leads to the microwave oven), Fangraphs made this awesome tool and I found the correlation between Swinging Strike% and ERA. The correlation makes sense. The more bats that you miss, the better you pitch. Of course, there will be outliers and there’s the old man school of thought that tries to induce weak contact. Pitching philosophy aside, there’s a correlation between missing bats and ERA and the graph below displays that.

I plotted ERA and Swinging Strike rate against each other and found the line of best fit amongst the 2013 data. More simply, the line is what you might expect a pitcher’s ERA to be based on their Swinging Strike rate. Then, I found the largest differences between the expected ERA based on that line and the actual 2013 data points and looked for outliers. You can see that all of the pitchers that I highlighted find themselves separated from other performers.
Cole Hamels posted a 3.60 ERA in 2013 and was part of the reason that the Phillies fared so poorly last year. His expected ERA (eERA), based on the graph was 3.10. That difference of 0.50 ERA was nowhere near the largest on the map, but the perceived difference between a 3.60 ERA and a 3.10 ERA is substantial. Further helping his case for 2014 as a rebound year, he gave up a BABIP of .295. His Swinging Strike Rate was 5th in the majors.
Tim Lincecum lost nearly two miles an hour from his fastball in 2012 and struggled to figure things out that year. He continued to struggle in 2013, but if you remove his horrid month of May, Lincecum managed a 3.94 ERA. Thanks to 25 earned runs allowed in May, his season line looks more like Scott Feldman’s: 4.37 ERA. But what about the sabermetrics? His eERA was 3.26. The graph, and corollary expected return to normal, makes the $35 Million commitment a little less scary and gives Giants fans something to be excited about.
Jeff Samardzija has a similar story as the two young aces mentioned above, but the back of his baseball card looked a lot worse thanks to a very poor second half. While a 4.06 ERA in the first half is nothing to write home about, it looks much better than the 4.72 that Samardzija posted after the MidSummer classic. His eERA was 3.36.
I also highlighted Edinson Volquez as his eERA was a full two runs better than his actual 2013 ERA. That likely had more to do with the fact that Volquez finished third in the NL in walks allowed. If Volquez can throw more strikes in 2014, the Pirates may have found another Francisco Liriano given Edinson’s propensity for missing bats.
You may also notice that Clayton Kershaw–the lone dot below the 2 ERA line– seems similarly separated from his peers on this graph. While that is true, I think it’s more likely that Kershaw is an alien than he slips back to his eERA (3.20) in 2014.
For the guys highlighted here, 2013 was not the great success that they were hoping for, but there are a number of factors that suggest 2014 will be a better year. Add this graph to the reasons to be optimistic about Jeff Samardzija, Cole Hamels, and Tim Lincecum in 2014.
-Sean Morash
Stat of the Day: Data Centers account for nearly 2% of annual electricity consumption in the US.


