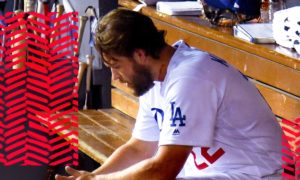
The St. Louis Cardinals are advancing to the NLCS following a homerun from lefty-hitting Matt Adams off of Los Angeles Dodgers lefty pitcher extraordinaire Clayton Kershaw. It was the first homerun off a Kershaw curveball ever hit by a left hander and led some (myself included) to question whether the great Kershaw were tipping his pitches. Former players had tweeted that Kershaw was likely tipping his pitches. The game’s best pitcher allowed more runs in two games against the 23rd best offense in the majors than he had in any of the last four months. The rumor was that Kershaw was tipping his curveball out of the stretch and the Cardinals had picked up on it. But Kershaw wasn’t tipping his pitches. He simply left a curveball right down the middle.
This Kershaw-tipping-his-pitches-in-the-stretch theory brought about a larger theory. How do pitchers fare when forced to go to the stretch?
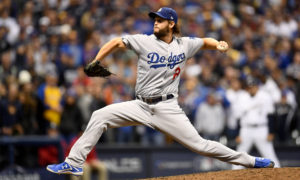
Kershaw has a .497 OPS allowed with nobody on, but that rises to .566 with runners on base. For some context, that’s like going from light-hitting Giants outfielder Juan Perez to light-hitting Cardinals shortstop Zack Cozart. While he’s still an exceptional pitcher, he fares better pitching from the windup. There are others, I’m sure, whose numbers may improve with runners on base (Yu Darvish comes to mind).
But what of the meta-data? Is there a trend across baseball that says pitchers fare significantly worse when forced into the stretch?
As much as I wish this were a simple question to answer, it becomes more complex with an increasing number of pitchers pitching exclusively from the stretch. Craig Kimbrel heads a list of many relievers who have found it beneficial to simplify things and ditch their windup even with no runners on base. Still, across all of MLB, these outliers likely won’t affect the data. Even if they did, Kimbrel would do damage to the theory since he’s an alien who doesn’t allow any hits.
In 2014, pitchers allowed a .253 average with runners on base and just a .245 average with nobody on. Simplifying and rounding, those 9 points in average equate to about 600 more hits. It’s not just batting average that indicated a trend; pitchers allowed a .305 wOBA with nobody on, but that number escalated to .324 once a runner got aboard.
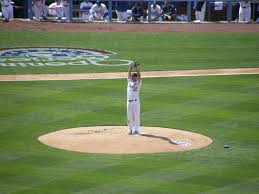
These numbers shouldn’t surprise anyone. With runners aboard, the pitcher must vary his delivery to keep the baserunner off balance, often employing a slide-step that reduces momentum and power from the legs. Further, pitch selection may be altered to avoid wild pitches, and/or the pitcher may be more apt to pitch carefully to a dangerous hitter, thereby issuing the old unintentional intentional walk. Lest you think this is some (very knowledgeable wife’s) wives’ tale, in 2014 pitchers threw about 1.3% fewer strikes with a runner on base. I’m not sure that that really means anything, but it is an interesting trend.
So, pitchers pitch worse out of the stretch–but by how much? Across the major leagues, wOBA indicates that they pitch about 6% worse with runners on base, when they pitch from the stretch. As for Kershaw, throughout his career, he’s pitched about 3% worse from the stretch. Even in this, his magical 2014 season, he’s pitched about 10% worse from the stretch according to wOBA.
Maybe there is something to this Kershaw-tipping-his-pitches thing. Probably not. This week’s uncharacteristic propensity for allowing runs had more to do with leaving that curveball hanging than anything else. The scary news for the 2015 baseball season is that I have identified the area in which Clayton Kershaw can improve: pitching from the stretch.
-Sean Morash
Stat of the Day: The White Sox threw 2007 more pitches this year than the Giants.