I just emerged from a trip through Baseball Savant’s new treasure trove of baseball data. It felt like a baptism into a new world of baseball data that I only caught glimpses of through Fangraphs pitch f/x screens. But there I was embroiled in thousands of data points and I didn’t know what to do. There’s exit velocities, pitch movement, release point, spin rate, and game situation available for every pitch thrown last year. Where does one possibly begin?
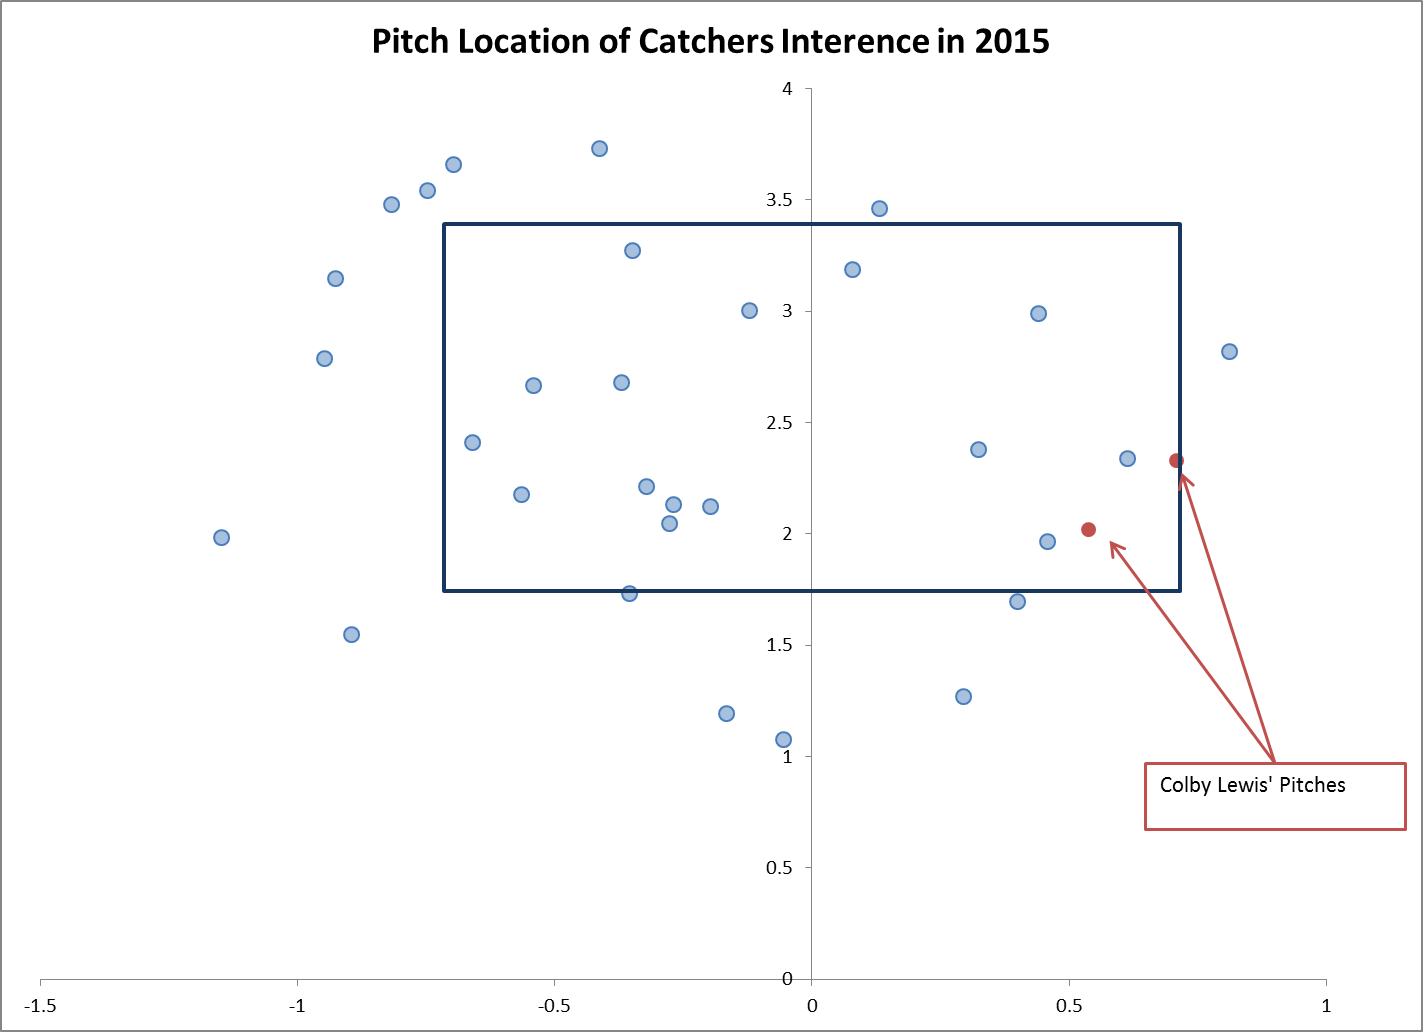
Well, first things first, I thought and so to the Catchers’ Interferences I went. Using Colby Lewis‘ two catchers interference calls to understand what I was looking at, I began to realize just how powerful this tool could be. I understood why David Cameron was encouraged that we would learn something very cool from Statcast in 2016. I also understood that that long-sought discovery would not be found by deciphering why Colby Lewis had managed to induce (throw?) different catchers interference on different pitches nearly five months apart, or further decipher why he managed to be the only pitcher to do it twice last year. And why are they both in that quadrant of the strikezone?!
Baseball is weird. It is full of oddities and plays that you’ve never seen before, but baseball nerds find inner peace in “sample size” that because of the length of the season results in normalizing of the all that is right and holy. Baseball itself finds peace knowing that today’s scorched lineout becomes tomorrow’s auspicious RBI flare double that lands on the chalk. So in this treasure trove of new data that is being collected by MLB Advanced Media, we’re supposed to filter through those Colby Lewis Catcher Interferences and find larger trends that help to educate the game. Supposed to. How can I possibly look away from those two red dots?
At least temporarily, I must look away. While on my trip through Pitch f/x data, I discovered something genuinely worth sharing. I figured out where not to pitch it. Pitching is difficult and hitting is considered the hardest thing to do in sports. If it surprises a hitter, a pitch right down the middle can be a good pitch. Other times, a pitcher painting the black is rewarded with an opposite field home run. Baseball is weird.
Across all these individual plays, there are overarching theorems and maxims at play. Keep the ball down. Work ahead in the count. Mix pitches, tempo, and sequences. Baseball has these theorems for a reason. Presumably, over the last century, baseball people have learned something about how to play the game and have taught it to the next generation. With the new data, we can test those theorems. First up: where a pitch should be located.
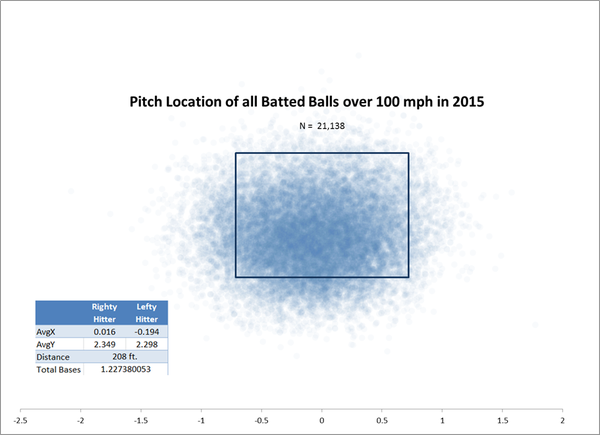
Maybe I’m going about this wrong, but it seems like it’s easier to eliminate places to throw a pitch than to identify the optimal pitch from the infinite number of possibilities. The optimal pitch is one results in an out. That’s different under different circumstances. Regardless of circumstance, giving up hard hit balls is the sub-optimal outcome. Here are all the pitches that resulted in batted balls over 100 mph last season.

So basically don’t throw it right down the middle. Ok, got it.
But there’s more at play here. You can see from that little chart that both right handed and left handed hitters prefer the ball on the inside part of the zone. They further prefer it in the 28″- 29″ range. The strikezone is typically called from around 20″-40″. That hitters prefer the ball on the lower half of the strikezone suggests that the downward transition of the strikezone may have influenced batted ball statistics. I think it is far more likely that umpires naturally shifted to calling more strikes where the balls are hit the hardest.
The data also reveals that lefties like it a little more down and a little more in than their right handed counterparts. This echoes the long-held baseball belief.
But pitch location is only half the equation. What about pitch type? Well….
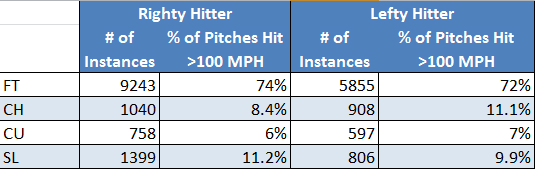
This may tell you something exciting that it doesn’t tell me. I suspect that the percentages are largely in line with the percentages of all pitches thrown, but the difference in offspeed preference is telling. We know that there are more right handed pitchers in the game (roughly 60%) and we know that switch hitters often switch hit to avoid seeing the ball break away from them.
Both handed hitters comparatively prefer the balls that would traditionally break away from from as a right handed pitcher. Lefties hit all changeups about 3% more often above 100 mph than their right handed counterparts. Meanwhile, righties hit sliders about 2% more often above 100 mph than their left handed counterpart.
So what does all this tell us?
It confirms our suspicions that throwing a pitch middle in, and a little down is a bad idea. We also learned that hanging offspeed stuff tends to get hit harder if it was supposed to break away from the batter. These aren’t new discoveries in the baseball world, but that’s OK. Not every discovery has to be new, novel or otherwise revolutionary. I’ve helped to ensure that all pitchers now know where not to throw it. Giancarlo Stanton also taught pitchers not to throw bad breaking balls middle/in and down, just a little differently.
-Sean Morash


