Bryce Harper and The Value of Consistency
One could argue that two ‘different’ hitters have donned #34 for the Nationals over the past five years. Bryce Harper’s numbers from 2014-2017 and through half of the 2018 season can be separated into distinct time-frames telling different stories about what a club will be buying during Harper’s coming free agency. Streaky hitters are not abnormal in baseball, but when streaks show up as good seasons and bad seasons, rather than good months and bad months, should that affect player value?
The two faces of Bryce Harper
In 2015, Harper slashed .330/.460/.649 on his way to becoming the unanimous NL MVP. His season accumulated 9.3 fWAR—tied with Mike Trout for MLB’s highest that year. 2017 showed similar elite production at the plate when Harper slashed .319/.413/.595 while accumulating 4.9 fWAR. In a combined 900+ at-bats during his 2015 and 2017 campaigns, Harper smashed his way to an OPS of 1.065, utter dominance of MLB competition. Nearly half of Harper’s career fWAR was accumulated during these two seasons (14.2 out of 28.5).
But during 2014, 2016, and the first half of 2018, Harper accumulated a total of 5.8 fWAR; providing less than a run more of value in two and a half seasons than in 2017–the worse of his two dominant seasons. As of the time of this writing—and a solid start to the second half—Harper sits at .231/.379/.492 in 2018.
Various things are considered causes for down-turns during 2014, 2016, and 2018. During 100 games played in 2014, Harper struck out nearly 25% of the time (a mark he had not come within 5% of again until 2018) and walked at his lowest rate. In 2016, Harper hit more balls—nearly 20%–classified as softly-hit than any other season of his career. Additionally, he posted the highest fly ball percentage of his career. The result of this combination was Harper’s lowest career FB/HR ratio.
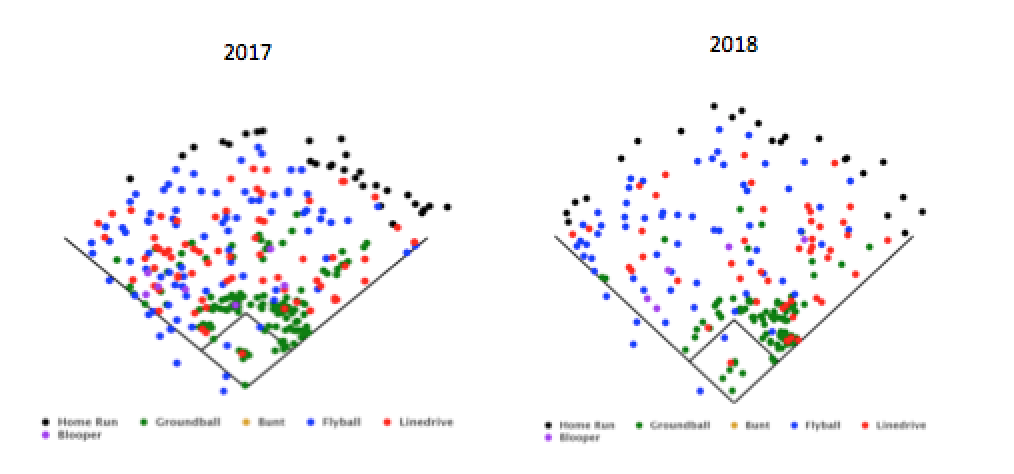
Thus far in 2018, Harper has shown heavy departures from his finest form. Particularly concerning are his 10% rise in pull-side batted balls over 2017 and his highest swing-and-miss rate against pitches in the zone. This has made Harper particularly susceptible to the MLB’s aggressive shifting. Compare Harper’s spray charts from 2017 and 2018 (below).
What should clubs take from this?
The value of a win varies and contracts are paid based on projected WAR. The projected value of a win during the 2017 offseason was $10.5 Million. To simplify, I’m going to use an average win value of $10 million/fWAR going forward. Three position players received contracts of five years or more prior to 2018: Eric Hosmer ($144m/8yrs); Lorenzo Cain ($80m/5yrs); and J.D. Martinez ($110m/5yrs). These three are tough to compare with Harper, so let’s focus on the two former Royals, Hosmer and Cain from this class for two reasons: age and position.
Eric Hosmer was the only 2017 free agent under 30. At $10 million/fWAR, Eric Hosmer is expected to provide 1.8 fWAR per year, on average, and a bit over 14 fWAR throughout the life of his contract with the Padres. This value lines up perfectly with his value from 2014-2017, where he produced 1.9 fWAR on average due to year-long peaks and valleys. While his overall numbers are not as impressive, his path to the numbers he has produced has been just as inconsistent as Harper. An important note is that Hosmer’s best year came during his contract year and 27-year-old season.
On paper, the Padres payed for a player entering his prime who had already led a club to a World Series championship and just came off his best season. If Hosmer produces at or near his 2017 rate during the 2018-2021 seasons—his 28-31-year-old seasons—and regresses during the final four years of his contract, he would be a steal. Unfortunately, he has had his worst showing in 2018, failing to amass a positive fWAR so far. Hosmer has continued the trend of having poor seasons follow up good ones. How varied have the performances been? Well, Hosmer’s career OPS sits at .773—in 2017, he finished the season .109 points over his career average. To date in 2018, he sits .072 points below it; a .178 difference from last season.
Lorenzo Cain was the only true outfielder to get a 5-year contract last offseason. During the 2014-2017 campaigns—his 28-31-year-old seasons—Cain averaged 4.25 fWAR. Because this occurred during his projected prime years, Cain’s contract value expects regression as he moves past his prime. Based on a $10 million/fWAR valuation, the Brewers hope for Cain to produce 8 fWAR during the life of his contract, averaging 1.6 fWAR per year. Projections estimate Cain to finish 2018 at 5 fWAR (he has produced 3.8 fWAR to date)—over 60% of his 5-year dollar value in just one season. Unlike Harper and Hosmer, Cain has shown a more balanced level of production in his last four full seasons; bottoming out at an OPS of .747 in 2016 and peaking in 2015 (en route to a World Series championship) with a .838 OPS; a separation of .091—a window half the size of Hosmer’s. His 2018 OPS sits at .808, squarely within his window of past production, showing no regression during his 32-year-old season.
After seeing the beginnings of contracts issued to Hosmer and Cain, it’s not a stretch to see front offices weighing in Harper’s inconsistencies when deciding how much financial risk to take. Over the past years, predictions of a contract in the ballpark of $600 million over 15 years—concluding with Harper’s 41-year-old season—have surfaced. That type of deal would expect an average of 4 fWAR per year and 60 fWAR throughout the term from Harper.
Harper’s OPS in 2014, his worst of the past 4 full seasons, was .768. He followed that up with an MVP season in 2015 and his highest single-season OPS: 1.109—a difference of .341 from the year before. Just like Hosmer’s OPS high-low window was twice the size of Cain’s, Harper’s is twice the size of Hosmer’s. Harper averaged 4.7 fWAR from 2014-2017, on par with the numbers that a megadeal like the one above would dish out. If you remove Harper’s MVP season from that group, you see an entirely different player: averaging 3.1 fWAR.
While Harper’s OPS (.875) is still among the highest in the league, it falls below his career OPS (.898) and is a far cry from his 2015 numbers; further muddying the waters about which version of Bryce Harper is hitting the market this winter. 4 fWAR is light work for the 2015 version of Harper, but an above-average performance from the 2014, 2016, and 2018 versions of Harper.
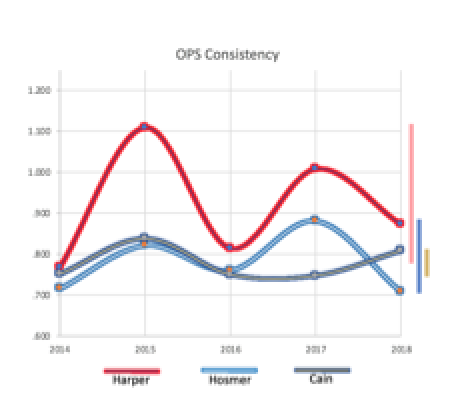
Hosmer and Cain’s performances during the initial year of their contracts suggest that less consistent performances can be a hint for teams to be less reliant on free agents’ future projections. While Hosmer showed his best self before hitting free agency to earn his money, Harper has shown some of his worst traits. This exposure should alert teams to consider Harper’s imbalanced production during his valuation. The illustration below shows how imbalanced Harper’s performance has been.
Despite being a phenom of raw talent, half of Harper’s last four seasons have had comparable results to other players in the league. While Scott Boras tries to sell Harper as the most projectable player in baseball—deserving of the largest contract in MLB history—teams will have to consider if only half of their investment is actually going to a superstar, while the other half goes to a player with multiple peers.
If a team approaches the Harper sweepstakes based on projections from his best years and pays him in excess of a half billion dollars, they could reset the free agent market for elite position-players in a dangerous way. As an example, compare Kris Bryant’s career (2015-current) slash line (.286/.387/.519) to Harper’s (.278/.386/.512). While Harper has about 900 more at-bats, their production has been remarkably similar. The path to that production has been very different: Bryant averages 6.8 fWAR per season and his OPS high-low window is .092; one point removed from Lorenzo Cain’s from 2014-2017.
Bryant has given the Cubs over $200 million dollars’ worth of value in three full seasons. Giving Harper a record-breaking pay-day based on his youth—despite his lack of consistency—would set the stage for players like Bryant to walk through contract negotiations armed with consistency as a weapon. As we’ve seen with Hosmer and Cain, ageing curves may require a looser application to players with a track record of maintained consistency. If Bryant’s overall numbers continue to resemble Harper’s into their 30’s, it will be tough for clubs to justify paying Bryant less in free agency than Harper will get during the remaining years of a 15-year megadeal.
Nobody knows this better than Boras—the agent representing both players.
Despite Harper’s potential for greatness, clubs have to be cautious of his inconsistencies. If Harper begins 2019 as the highest paid player in MLB history, the stage will be set for players like Bryant, to take advantage in his 30’s and the market for young free agents will inflate to an unaffordable level—a dangerous proposition for a league pushing to become younger each year. If Harper’s up-and-down trend continues, as it has with Hosmer, there is no projection model that can tell you when to expect his worst and when to expect his best. That’s a tough pill to swallow for a team with a 4 or 5-year window of “going for it” that decides to write a $35-$40 million check every year until 2018’s kindergarten class is draft eligible.
-Nico Zych


