Pre-Season Baseball Predictions vs. Reality: Predicting Better for the Short-Term and Long-Term
Baseball, as you may have heard, is a numbers game: Statistics underpin every front-office decision (determining player value, contract size and length), and are increasingly influencing the on-field product (via both defensive shifts and offensive approaches). Every MLB franchise has an analytics department (most are rapidly increasing investment in the area) with a simple mandate: Extrapolate future performance from historical data.
As much as GMs base their livelihoods on projection, we the consumers feed off it even more. Prognostication has always been at the heart of the fan experience, and the new age of sabermetrics – and sites like FanGraphs – have given laypeople the tools to dive in deep.
But no science of prediction is exact. And with the completion of a season comes the opportunity to reflect, and evaluate the forecasts that sparked so much optimism and argument way back in March. So let’s take a look at a few high profile predictions from 2018’s infancy, and see how they stacked up now that all the chips are on the table.
Since they’re awesome, let’s use FanGraphs, the paragon of accessible, cutting-edge information and statistical analysis for America’s Pastime. The site publishes multiple systems (algorithms, or formulas) for predicting future performance:
- ZiPS
- STEAMER
- ATC
- A Marcel projection system
- A form of regression analysis
Each system has certain properties that may sway a user’s preference when going really deep, but happily, they also list a composite prediction for those less inclined to discriminate.
Mike Trout
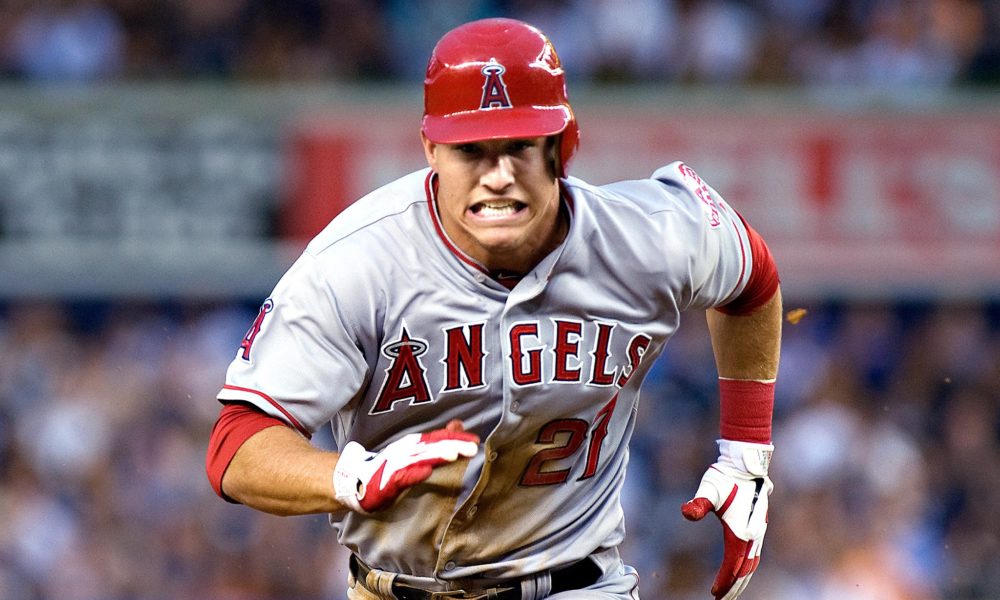
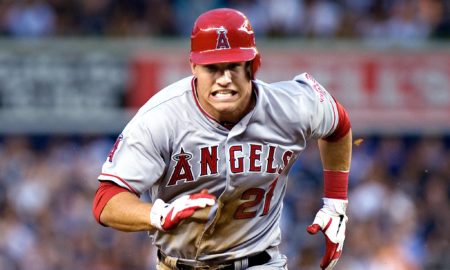
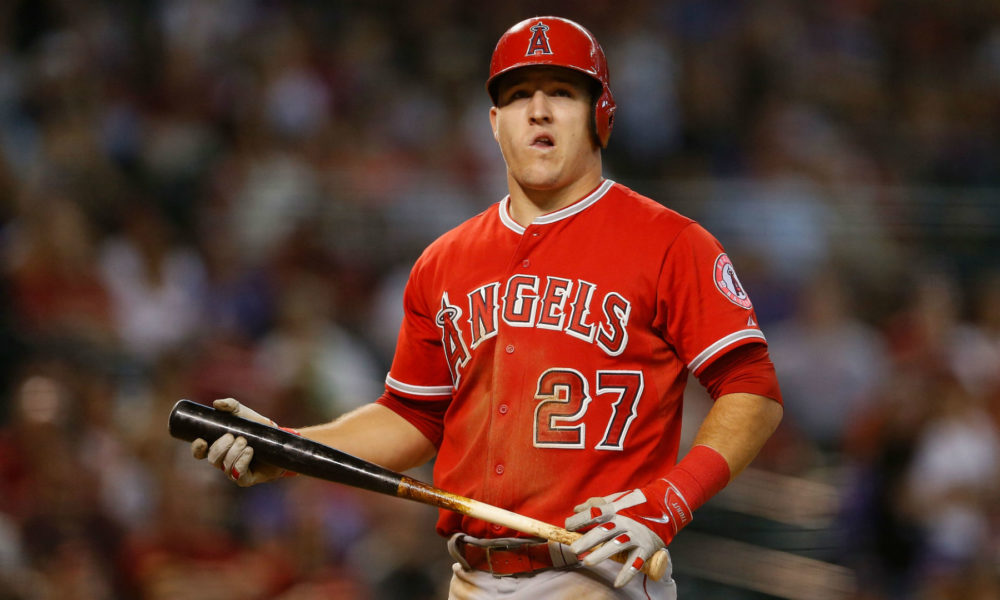
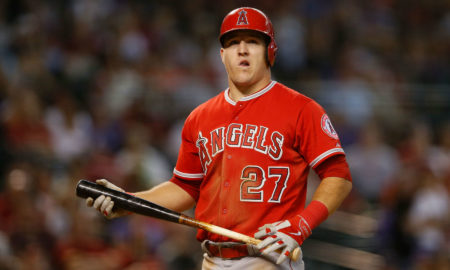
It should come to no surprise that all projection systems predicted Mike Trout to finish atop the heap in terms of WAR – and by a wide margin, too. Lo and behold, he ranked second with 9.8 total in 2018. There is a massive asterisk here, as Trout missed 20+ games with a torn UCL in his thumb. That he managed to outperform projections in the rate categories despite the surgery is ridiculous, and the injury appears the primary culprit for his failure to do so in RBIs and Rs. That they system nailed its prediction with HRs and SBs, with 39 and 24 respectively, belies the true brilliance of his performance.
Comparing Trout to other player’s in today’s game is mostly unfair as he continues to make a case for GOAT at just 26. We shouldn’t be making projection systems to figure out whether Trout will hit a new career high in homers. That’s not all that fun. Where the projection systems get interesting are in the cases of guys like Kyle Seager and Blake Snell.
Kyle Seager
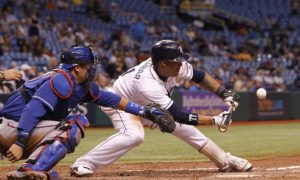
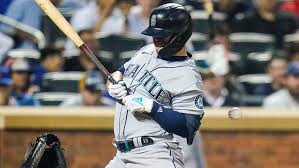
From the ZiPS pre-season projections, Kyle Seager was forecasted to boast a .271 AVG to go along with 28 home runs and 96 RBI, which helped contribute to a projected 4.2 WAR. In reality, Seager wound up having one of his worst years to date, posting a .221 BA with 22 home runs and 78 RBI, resulting in a 0.8 WAR.
Blake Snell
On the other hand, projection systems can be wrong in the other direction as well. We saw this with the now-Cy Young-contending Blake Snell, who put up monster pitching numbers for the Rays. Snell threw to the tune of a 1.89 ERA with 221 strikeouts to go along with a 21-5 record. His 7.5 WAR is ranked fifth in all of baseball among pitchers. Pre-season projections were many orbits away, with ZiPS targeting an 11-9 record with a 3.70 ERA and 186 strikeouts. I’d say it’s safe to say Snell over-performed just a tad.
Consequences
Baseball is a game of unpredictability. And when it comes to any type of projection system, there is no sure thing. But in this age of analytics, the same erroneous projections that win you a side bet in your fantasy league can have echoing reverberations in the Big Business of Baseball. For Mike Trout, no intrigue remains: He is the league’s best player, and will be again next year. But what do the pre-season undervaluation of Blake Snell and overvaluation of Kyle Seager mean for the players and their respective clubs?
For Snell, coming into his arbitration years, this season will create some leverage. He will be able to point to it and demand a higher salary. But the Rays, for their part, will likely use the pre-season projection to their favor, arguing that Snell’s 2018 was anomalous. Things will find a middle ground, and Snell will make more than he would have had he performed to the prediction, while the Rays will still be getting a potential Cy Young winner at a bargain compared to market value.
Seager, on the other hand, signed a seven-year contract worth $100,000,000 back in 2015, so ostensibly his decline would seem worrisome for the Mariners. However, while his 2018 may have been ugly compared to the projections, Seager’s story is about a body of work over the life of a contract. Including this year, Seager has posted a 14.5 combined WAR since signing his deal in 2015. With 1.0 WAR being valued at ~$9 million in today’s game – and trending upwards – Seager has already out-performed the total team-value of his contract, with three years remaining. Even if he spirals for the back end, from a dollar-for-wins standpoint, he’s already proven to be a good signing for Seattle; if he picks things back up, it will be a steal.

