What the Brewers Bullpenning Means for Team Velocity
William Russell Frisbie bought a bakery in Connecticut in the late 19th century. He called the bakery the Frisbie Pie Company. They were pretty good pies. Some 80,000 pies were made
William Russell Frisbie never intended to produce a flying disk, but the “frisbee” is one of the more popular toys on Earth now. Sometimes, you fall
I made a chart. It was a pretty good chart that synthesized a bunch of data. As far as
I don’t often think of my blogging process as science. I prefer to think of it as fun notes that provide insight into both baseball and how my brain works. Sometimes, particularly when I do something more math-heavy, the scientific method provides a useful prism through which to consider that insight, but more often, science should be left to true scientists and should stay away from baseball and fun.
Unlike good science, I only report out on the more interesting tidbits, on the observations that result in worthwhile conclusions. Good science reports on everything. But today, there are interesting tidbits all over the process. It’s all worth reporting.
The Observation
In assembling data on my Luis Castillo post last week, I noticed that Jacob DeGrom, Seth Lugo, Zack Wheeler, and Matt Harvey each gained velocity as the year went on during the 2018 season. Each of those guys started the year in the Mets rotation. DeGrom and Wheeler also put together dominant second halves. Harvey added about 2 mph after shifting to Cincinnati and appeared to be semi-recovered from his arm troubles. But I wondered if something deeper was at
My heart sank a bit earlier this week when I saw Jeff Sullivan’s headline: Mets Pitchers Adopted a Whole New Identity. This would not have been the first time that Sullivan stole a post idea from my brain. With that, I was inspired to look deeper.
The Hypothesis
Led by noteworthy velocity gains in their rotation, Mets pitchers added more velocity than anyone else during the course of the season.
The Test and Data
I assembled the individual pitching data from last year, split them up into the teams, and tossed out the non-fastballs.
There’s a lot here, obviously. So much so that it’s hard to make much sense of anything. But we do see that that the Mets gained velocity as the year went on; they even finished with the fastest fastball in baseball in September.
We also see that the Brewers gained lots of
While you take a moment to ponder why the average Major League fastball gets faster as the season wears on, I’m still caught up on the Brewers’ ascension. They went from 29th in baseball in fastball velocity to right in the middle of the pack. Let’s isolate them for you.
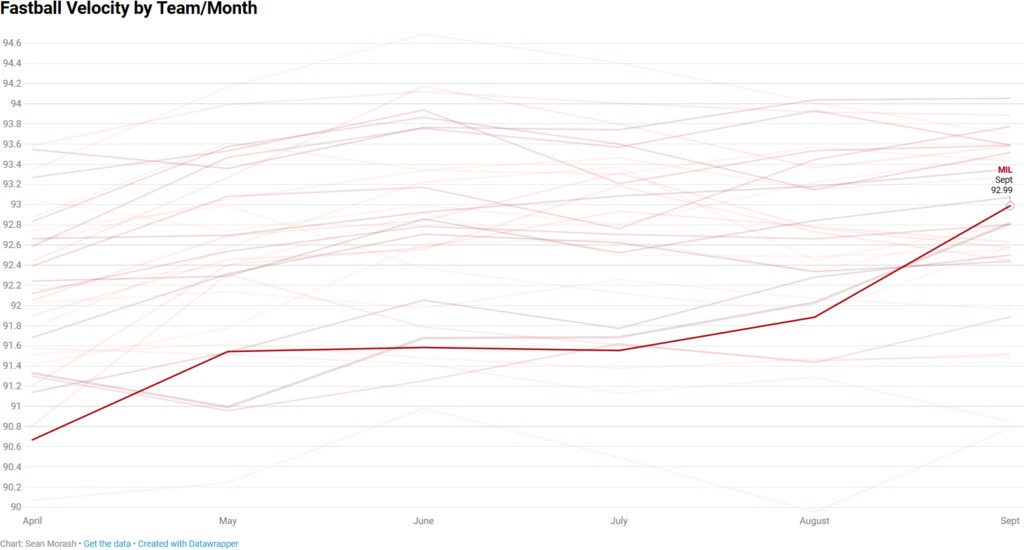
This is an interesting shape because we see that the Brewers increased as the year went on, but they really shot up in September. We also know that the Brewers embraced their bullpen in September and October. They realized that their best asset was their bullpen and they rode guys like Josh Hader hard to the playoffs. We see this with how they shifted innings away from the 8 guys that they used primarily as starters in 2018.
| April | May | June | July | Aug | Sept | |
| Percentage of Pitches Thrown by “Starters” | 63% | 58% | 59% | 56% | 57% | 54% |
We can also see how those subcategories performed.
I don’t have a great explanation for the Brewers relievers’ slight jump in velocity in September other than to suggest that they likely gave more of those innings to their best and hardest-throwing relievers.
Discussion
The overall trend here is clear. Relievers throw harder. Throwing harder correlates with more strikeouts and ultimately fewer runs scored. The Brewers learned that lesson somewhere in the middle of 2018 and saw their overall team velocity increase as a result. It is unclear what this type of usage will mean in the long run for player health, but it is obvious that the effect of
But the Mets also shouldn’t be ignored. Teams are adopting this bullpenning strategy because they do not have the luxury of quality starting pitchers. The Mets led the league in pitching velocity in September led by their quartet of Jacob DeGrom, Zack Wheeler, Noah Syndergaard, and Steven Matz. Let’s not sleep on the potential of those pitchers just because it hasn’t worked out in the past, or because my chart showed something slightly different than was expected.
The Mets and the Brewers are approaching the 2019 season in quite different ways. As the season goes on, they may just learn something noteworthy, and pivot to something even more successful. The Frisbee Family could teach them a thing or two about that.
-Sean Morash


