The “Just Right” Number of Pitches
I’d like to take you behind the curtain at Off the Bench Baseball. Max Frankel, who is one of the two Grand Poobahs of the site along with Sean Morash, texted me a Twitter link the other day. His palpable glee was evident even through SMS, and he asked me to write an article about the tweet. I have embedded said tweet below:
It is indeed a pretty cool tweet. There’s a lot of good stuff going on with this data. However, the data wasn’t quite accurate, and Alex Chamberlain soon tweeted a correction.
It’s okay Alex, we forgive you! This is still a fascinating discovery.
Max’s instructions to me were, “I want to do an entire week of posts just about this, coming at it from different angles. I’m happy to leave the specific angle you’d take up to you.” (Editor’s Note: That week is still pending, but this post was great so we wanted to get it out there)
Most of the time, my meandering thoughts lead down a path none should follow. As per Max’s orders, I will now take you with me down that path. Fortunately for you, I kept it rated-G. This time.
A Primer on Swinging Strikes
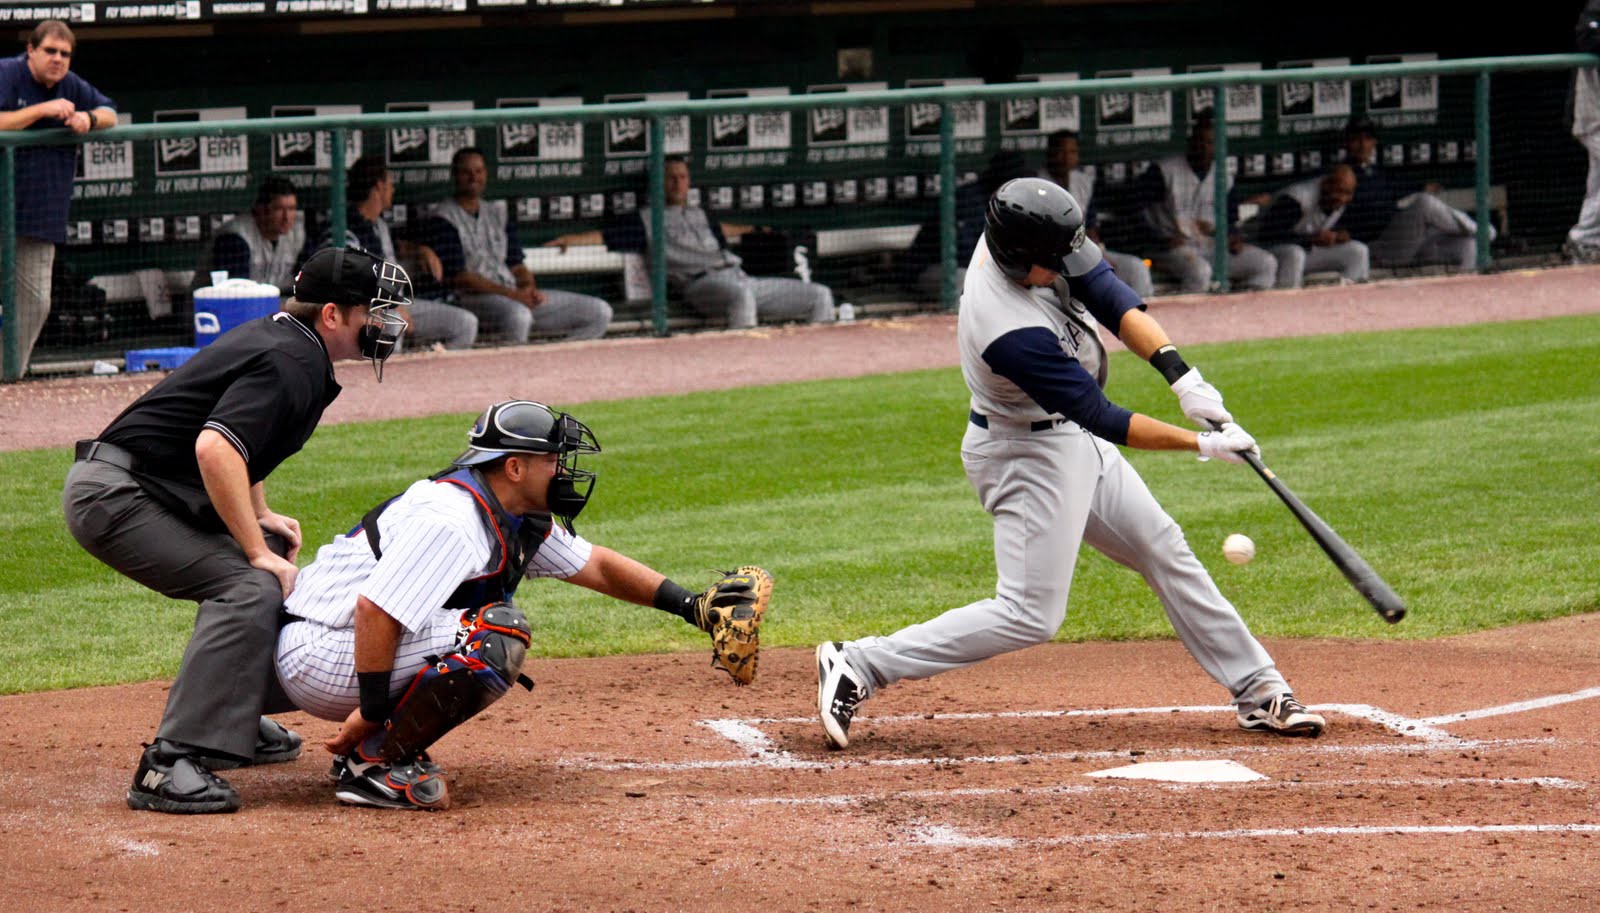
A swinging strike is the best outcome a pitcher can hope for on any given pitch. It’s more impressive than a called strike because the batter recognizes it’s in the zone, decides to swing, and is still unable to make contact. Pitchers that induce a lot of swinging strikes tend to be pretty fantastic, as evidenced by the 2018 leaders:
| Pitcher | SwStrk% |
| Max Scherzer | 16.2% |
| Patrick Corbin | 15.6% |
| Carlos Carrasco | 15.3% |
| Blake Snell | 15.1% |
| Jacob deGrom | 15.1% |
Chamberlain’s discovery indicates that when a pitcher throws the same type of pitch twice in a row, he has a greater chance of inducing a swinging strike. This is counterintuitive. Generally, you would expect a pitcher to get a swinging strike by keeping the hitter off balance, such as following a fastball with a changeup. Apparently, this might not be the case.
On the other hand, this data is not adjusted for how well these pitches generate swinging strikes on their own. The highest combo for swinging strikes is splitter-splitter. Splitters are designed to appear like mediocre fastballs down the middle, then the bottom drops out after the batter commits to swing. Rarely are they thrown in the strike zone on purpose. The pitch is designed to generate swinging strikes more than, say, a backdoor slider.
So maybe this data is meaningful, and maybe it isn’t. Regardless, if a pitcher is throwing the same pitch consecutively, it begets other questions about his arsenal.
Putting the Arse in Arsenal
If a pitcher throws two consecutive sliders, for example, it could be for one of several reasons.
- The scouting report says to inundate the batter with sliders.
- He has a better feel for his slider than his other pitches on any given day.
- He doesn’t have that many other pitches.
The first two potential reasons are specific to a batter or outing. The third might explain season-long data.
Each pitcher has certain pitches in his arsenal. There are no one-pitch pitchers (oh, how I miss Mariano Rivera!), but every hurler relies on 2-6 pitches. Ken Giles throws just a fastball and slider, while Masahiro Tanaka features a fastball, slider, splitter, cutter, curveball, and changeup.
One hypothesis from Chamberlain’s data dive is that pitchers with fewer pitches in their arsenals generate more swinging strikes. This also seems counterintuitive at first blush, but it might actually make some sense. When you throw two super nasty pitches, you don’t need a third option.
Here’s a Ken Giles fastball, swinging strike:
And here’s his slider, another swinging strike:
See? He can throw either pitch several times in a row because, frankly, the batter can’t touch him either way!
Testing a Hypothesis
Let’s dig into some data. If this hypothesis holds true, we should see some negative correlation between singing strike rate and number of pitches in a pitcher’s arsenal.
Unfortunately, this doesn’t appear to hold up. For starting pitchers who threw at least 50 innings last year, the correlation between swinging strike rate and number of pitch types was -0.06. For relievers, it’s -0.16. Both of these are way too weak to suggest anything meaningful.
Here are the average swinging strike and strikeout rates for starting pitchers, grouped by number of pitch types:
| Pitches | SwStr% | K% |
| 6 | 11.25% | 22.32% |
| 5 | 10.04% | 21.66% |
| 4 | 9.95% | 21.16% |
| 3 | 10.57% | 21.90% |
It’s worth noting that there are only two pitchers that feature six pitches: Tanaka and Jhoulys Chacin. Also, there are no two-pitch starters. You need a minimum of three to turn over a lineup multiple times.
Here’s the same data for relievers:
| Pitches | SwStr% | K% |
| 5 | 10.42% | 24.83% |
| 4 | 11.82% | 24.58% |
| 3 | 12.44% | 25.69% |
| 2 | 12.10% | 25.77% |
This chart looks like it might lead somewhere. However, any pitcher with five pitches who can’t start probably doesn’t have a real put-away pitch to begin with.
It appears that the data is pretty consistent. It doesn’t really matter how many pitches a starter throws; it’s how well he throws them.

