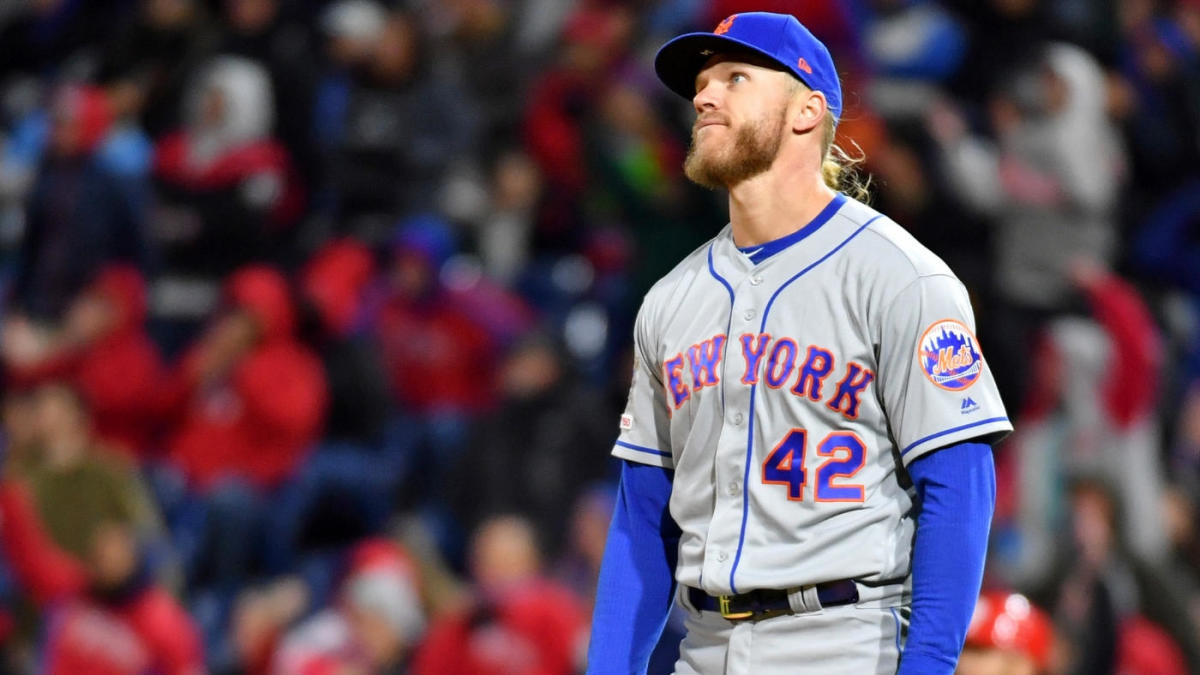
Noah Sydergaard is a League Leading Starter (84% of the Time)
Statistics are weird. Probabilities are even weirder. Most people don’t understand them and even those of us who have been trained in stats and probabilities often can fall victim to thinking of outcomes in the absolutes.
Either you win or you lose. The fact that a given player added .34 to his team’s win probability in a losing effort is a weird outcome of the WPA statistic. It doesn’t make a ton of intuitive sense and intuition still drives a great deal of our primal thought.
Our primal instinct tells us that Noah Syndergaard is a good pitcher; he throws the hardest fastball in baseball by nearly a full mile per hour. He often gets good results, but sometimes he doesn’t. On average, things haven’t been great for Syndergaard this year.
The average performance this year for Syndergaard has resulted in an ERA in the bottom quartile of starters. You’re probably a little confused. ERA measures pitching outcomes and effectiveness, while scouting measures… something else. The point here, though, is that a few bad starts have damned Syndergaard’s averages.
His average performance has not been great, but do we really care about the average performance? Maybe it’s much more useful to understand what usually happens.
There are going to be stinky starting pitching performances. Every pitcher has them. In Pedro Martinez‘s miraculous 2000 season, he had a start in mid-August in which he gave up 6 earned and 8 hits. His averages weren’t screwed up too bad by that start – he still had a 1.74 ERA and a 0.737 WHIP for the season – but if we could just toss that one out, he would have had a 1.55 ERA and 0.72 WHIP. Maybe he had a poor night’s sleep the night before. Maybe he had an ex-girlfriend in the stands in Kansas City. Maybe it was raining.
The difference between average and usual may seem semantic, but let’s consider a more variable pitcher for a moment.
AJ Burnett was maddeningly talented and unpredictable. He had 10 career shutouts and 12 games in which he allowed at least 8 earned runs.
Burnett finished his career with just one All-Star appearance, but also a 3.99 career ERA and averaged about 6.1 innings per start. That’s his average start. But if we take the better half of his starts (so the top 215 starts), he had a 1.56 ERA. Half the time, you were getting something like 6 innings and 1 earned run allowed. The other half, you were getting a 7.30 ERA (something like 6+ IP and 5 ER allowed). It works out that his good starts included more IP than his bad starts so his career ERA wasn’t exactly halfway between the good half and the bad half. That’s some natural weighting at play.
Dividing things directly in half doesn’t help so much in assessing what usually happens when a pitcher takes the mound. That tells us more what happens half the time. I’d rather know what happens something like 85% of the time.
It just so happens that in statistics if one moves a standard deviation higher than the average, that gives us 84% of outcomes. In our instance, it would give us the 84% of best outcomes. It would tell us how a pitcher does in 25 of 30 starts over the course of a season, effectively throwing out the clunkers.
So if we wanted to find who the best pitcher in baseball is, if we throw out their clunkers, we would just need to take their average+1 SD of the chosen stat.
I had a difficult time finding a method that remotely resembled an automated assembly of game logs for pitchers this year. But luckily, Baseball Prospectus’ new stats leaderboards includes the standard deviation of pitchers’ Deserved Runs Average. For those who don’t quite remember, DRA is in its fourth year of existence and “It estimates the rate at which a pitcher ‘deserved’ to give up runs, and includes estimates for the uncertainty around that rate.”
Without being privy to what is going on behind the scenes at BPro (and therefore risking a misapplication of the statistic), we can still find the pitchers whose season ERA have been most affected by a few clunkers. Below is a leaderboard for starters who have thrown at least 30 innings on the season.
| DRA + 1 SD | DRA + 1 SD Rank | ERA | ERA Rank | |
| Hyun-jin Ryu | 2.78 | 1 | 1.27 | 1 |
| Stephen Strasburg | 2.79 | 2 | 3.79 | 45 |
| Charlie Morton | 2.86 | 3 | 2.43 | 6 |
| Jacob deGrom | 2.88 | 4 | 3.25 | 26 |
| Mike Soroka | 2.94 | 5 | 2.07 | 3 |
| Chris Sale | 3.06 | 6 | 3.82 | 46 |
| Luis Castillo | 3.06 | 7 | 2.56 | 9 |
| Max Scherzer | 3.06 | 8 | 2.52 | 7 |
| Brandon Woodruff | 3.16 | 9 | 4.01 | 60 |
| Lucas Giolito | 3.17 | 10 | 2.87 | 15 |
| Noah Syndergaard | 3.36 | 11 | 4.55 | 90 |
That so many of the league leaders in ERA also appear on the DRA+1SD leaderboard is a good thing. It shows that it’s not a totally useless statistic. It also shows us that Stephen Strasburg, Chris Sale, Brandon Woodruff, and Noah Syndergaard may have all been affected by clunkers. Syndergaard’s ERA is particularly poor relative to his DRA+1SD peers. That seems to indicate that he both had a few bad outings and that he did not quite deserve one of those clunkers.
Because of where in the season we are evaluating this, we are effectively throwing out 3 of 17 starts to get the 85th percentile. Strasburg’s ERA in those 14 good starts is 2.84 and he’s pitched nearly 7 full innings per start. Syndergaard has had 12 good starts this year that result in a 3.62 ERA and Brandon Woodruff’s 13 good starts result in a 3.01 ERA.
Now, this doesn’t tell us that these guys are the best pitchers in baseball. Those bad starts still count. But it does tell us that, despite their ERA, these guys are among baseballs best at usually providing good starts- that more often than not, they’re really good.
We have long battled the question of the value of consistency. Is it more valuable to know you’re getting 6 IP and 2 ER allowed every time or to get half the starts with 6IP/0 ER allowed and half with 6IP/4ER?
It depends on the quality of the competition, the efficacy of one’s offense, and how the team gets those final 9 outs. For some, like the Mets, who have an average ability to score runs this year combined with a dreadful bullpen, they may actually prefer the variability embedded in Syndergaard’s year-to-date performance. While those clunkers may burn bullpen arms and diminish morale, the excellent starts provide a greater opportunity to win than a whole bunch of average starts.
-Sean Morash


