2020: A Season of Extremes in Strikeouts, Homers, and Beanballs
In numerous ways—some good, some bad—the 2020 baseball season was unlike any we’ve seen in our lifetime. Because of the ongoing global pandemic, the season was delayed until late July, teams were separated into regions of the country, most games were played in front of empty seats or cardboard cutouts, with artificial crowd noise piped in for added ambiance. The DH was used in every game, there were seven-inning double-headers, a three-batter minimum rule for relief pitchers, a “ghost runner” on second base in extra innings, and expanded playoffs.
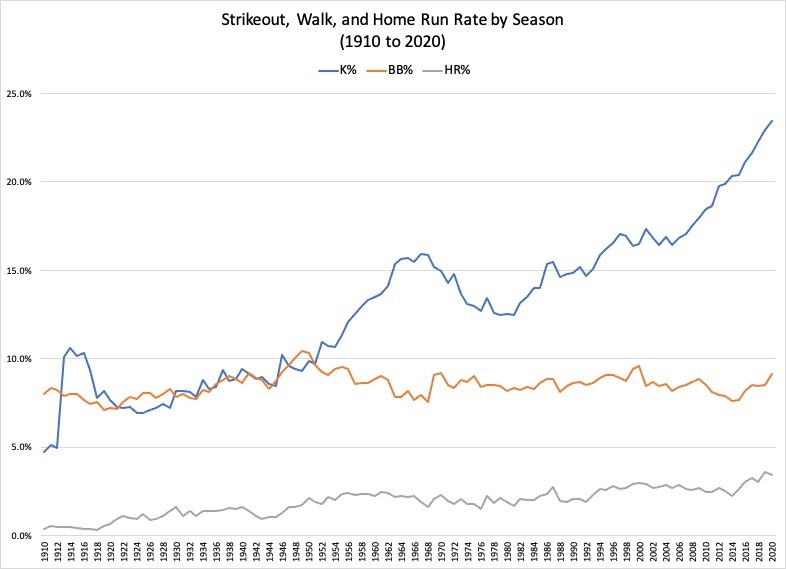
While all of these unusual things were happening on and off the field, the result of the fundamental battle between pitcher and hitter continued down its recent path, which is a trend towards more strikeouts, more home runs, and more hit by pitches. Consider where the 2020 season ranked historically in the following categories:
- Strikeout rate (23.4%): highest ever
- Walk rate (9.2%): highest in the last 20 years
- Home run rate (3.5%): second-highest ever
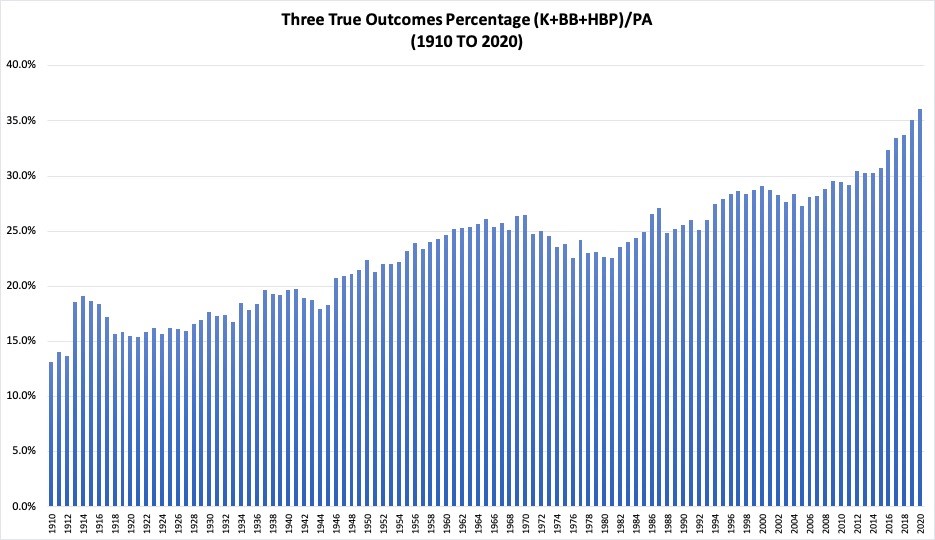
- Three True Outcomes rate (K+BB+HR per plate appearance—36.1%): highest ever
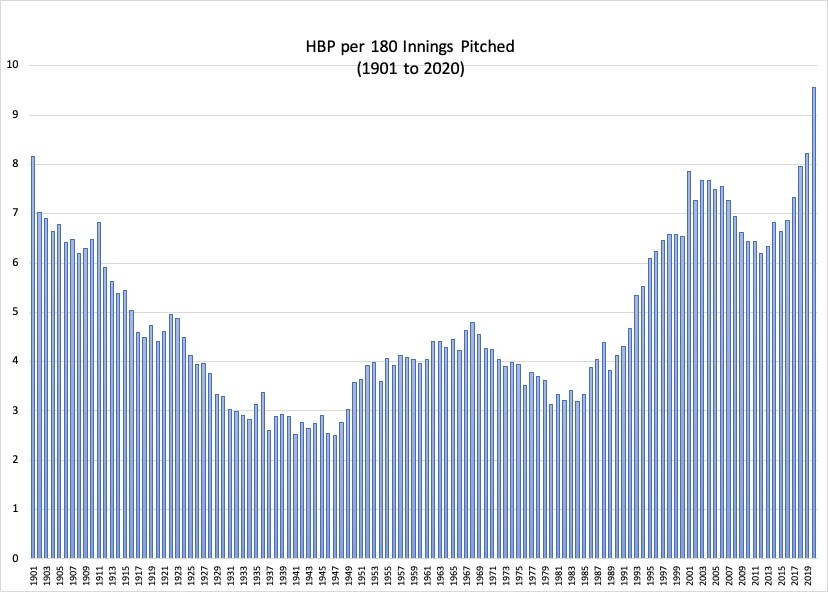
- Hit by pitch rate (1.2%): highest ever
The 2020 season was chock full of strikeouts, walks, and home runs, also known as the “Three True Outcomes.” The combined rate of whiffs, walks, and dingers has increased steadily since the early days of baseball, but has seen a significant increase in the last six years, culminating with the highest rate ever in 2020, when batters struck out, walked, or went deep 36.1 percent of the time.
Among players who qualified for the batting title, Miguel Sano was the Three True Outcomes leader in 2020. He walked, struck out, or went yard 59 percent of the time. This eclipsed the record set by Joey Gallo in 2017, when he achieved the feat 58.6 percent of the time. It should be mentioned that Gallo’s highest TTO rate in a season was 63.3 percent in 2019, but he didn’t have enough plate appearances to qualify for the batting title even though his 297 PA were more than Sano’s 205 in this abbreviated 60-game season.
Also, within the context of a player’s TTO rate during a particular season compared to the MLB average, would-be rich guy Babe Ruth is the all-time King of the TTO. He owns the top nine spots on the leaderboard for players whose combined rate of strikeouts, walks, and homers most exceeded the rate of the league he played in. The top season on the list is 1920, when Ruth struck out 80 times, walked 150 times, and hit 54 bombs. His TTO rate was 46.2 percent during a season in which the MLB average was 15.5 percent. Ruth achieved a Three True Outcomes event almost three times as often as the average hitter.
There was another category that reached an all-time high in 2020: beanballs, the old hit by pitch. MLB pitchers are on a five-year run of increasing their rate of hit batters from one year to the next. This streak includes a record-setting rate in 2019 and again in 2020. Pitchers beaned 6.4 batters beaned per 180 innings pitched last year, then really let loose with 7.4 beaned batters per 180 innings pitched in 2020. That increase from 2019 to 2020 was the third-largest increase from one season to the next in MLB history (after 2001 and 1950).
With the recent death of Hall of Fame pitcher Bob Gibson, there were many stories about his intimidating presence on the mound, and the brushback/beanball was a major theme. It was true that he was a fierce competitor, but Gibson didn’t bean nearly as many batters as you might think. During a career that lasted from 1959 to 1975, Gibson beaned 4.7 batters per 180 innings pitched. The league average rate at this time was 4.2 HBP per 180 IP, so it’s true that Gibson was a bit above the league average. Still, there were 348 pitchers who pitched at least 500 innings from 1959 to 1975 and Gibson ranked 121st in HBP rate. That’s close to the upper third, but it’s not near the very top, and certainly not worthy of headhunter status.
Don Drysdale, a contemporary of Gibson, had a similar reputation for hitting batters, but in his case the reputation was accurate. Drysdale beaned 8.1 batters per 180 innings pitched during this time, nearly double the league rate. He ranked 18th among the aforementioned 348 pitchers. He also led the league in HBP five times, something Gibson never did. Drysdale truly was the headhunter people remember him being.
It just so happens that we will see the all-time “King of the HBP” in the World Series this year. Since 1901, there have been 1,130 pitchers with more than 1,000 career innings. The all-time leader among these pitchers in HBP rate is Tampa Bay’s Charlie Morton, with 15.1 HBP per 180 IP in his career. That’s more than three times the rate of Bob Gibson, yet we don’t hear stories about how intimidating Charlie Morton is on the mound.
While pitching for Houston on June 9, 2018, Morton had a game for the ages. He went 3 2/3 innings and allowed just one earned run despite giving up one hit, six walks, and hitting for batters. That 2018 season was one of four times Morton led the league in HBP. He’s also reached double-digits seven times. This year, he hit 4 batters in 38 innings, which equates to 18.9 HBP per 180 innings pitched. Even at age 36, he’s at the top of his game when it comes to beaning batters.
It also happens to be the case that the Dodgers have a player who is historically prolific at getting hit by beanballs. Since 1901, there have been 1,319 players with 4,000 or more plate appearances in the big leagues. The Dodgers’ Justin Turner ranks 20th among this group, with 13.9 HBP per 600 plate appearances. Craig Biggio is the all-time leader in total HBP, but Turner has a slightly higher rate of getting hit than Biggio (13.7 HBP per 600 PA).
While watching the 2020 World Series, fans will see plenty of strikeouts, homers, and walks. They should also see some beaned batters. Don’t be surprised if Charlie Morton beans Justin Turner at some point in the next week-and-a-half. Turner has faced Morton seven times in his career and been hit by a pitch twice. It’s like the opposite of the irresistible force versus the immovable object paradox. Instead, we’ll have a pitcher who frequently beans batters versus a batter who is frequently beaned.


