One of the dependable truths of Major League Baseball is that relievers, as a group, will have lower ERAs than starters in a given season. This has been true for most of the average fan’s adult life, but it wasn’t always true.
From 1901 to 1963, starting pitchers, as a group, had a lower ERA than relievers every season. Starters were given the ball at the beginning of the game and expected to pitch deep into the game, which left relievers as an afterthought for many decades of baseball.
Starting pitchers averaged at least seven innings per start every year from 1901 to 1973 and in most of those years they completed at least 25 percent of their starts, so in one out of every four starts, relievers weren’t needed at all.
Until 1964, starters also had a better ERA than relievers every year. Relievers had the upper hand in 1964, 1965, 1966, and again in 1970. After a few years with starters once again having a lower ERA than relievers, the trend flipped for good in 1974, when relievers had an ERA that was 0.15 lower than starters. It’s been that way ever since, with relievers, as a group, having a lower ERA than starters every season from 1974 through 2020.
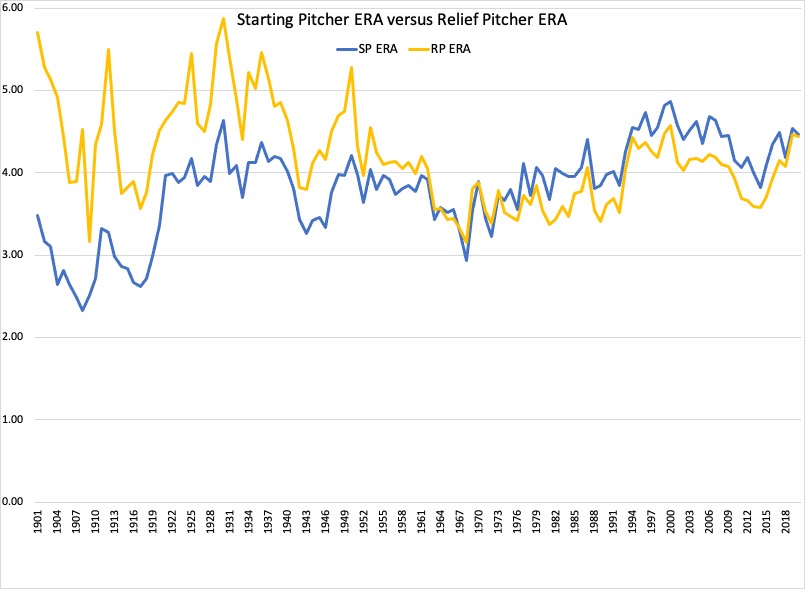
From 1974 to 2018, the difference in ERA between starting pitchers and relief pitchers ranged from 0.11 at its lowest to a high of 0.62 in 1982. Most seasons were in the 0.30 to 0.40 range, with relievers allowing about one-third of an earned run less per nine innings than starters.
While this was happening, the complete game dwindled nearly to the point of extinction, dropping from roughly 25 percent of starts in the 1970s to around 8 percent in the 1990s, to about 2 percent over the last decade.
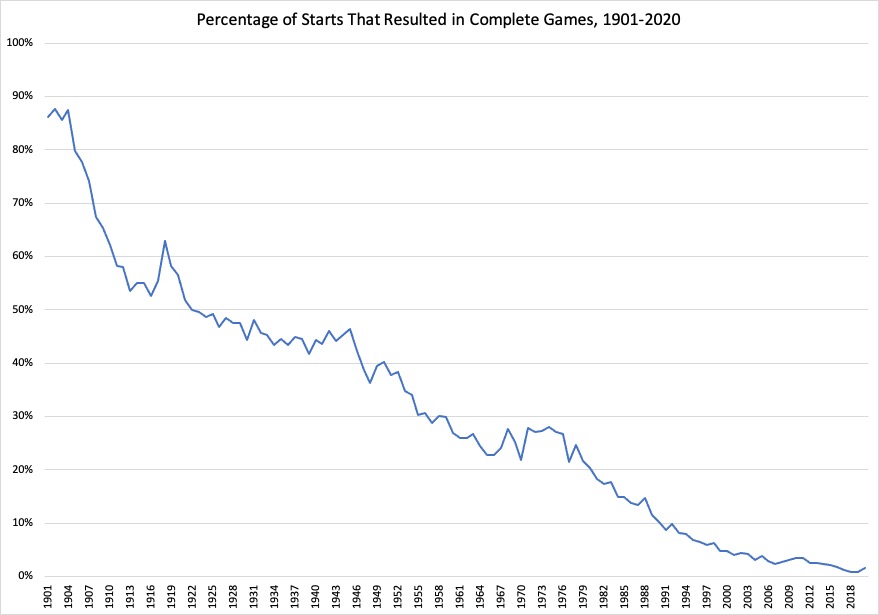
The percentage of complete games actually dropped to 0.9 percent in 2018 and 2019, then saw an artificial increase last year to 1.6 percent because of the 7-inning doubleheader rule. Of the 29 complete games pitched in 2020, 11 were 7-inning complete games and four others were under seven innings (complete-game losses or rainouts). That leaves 14 nine-inning complete games, which would have been a record-low for complete game percentage, at 0.8 percent.
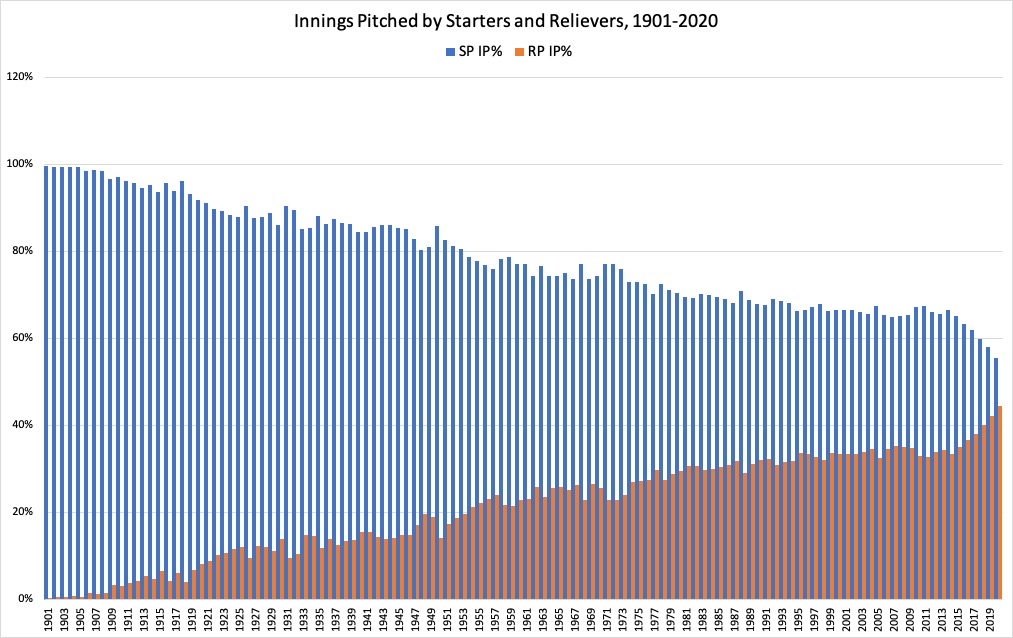
Along with completing fewer games, starting pitchers have thrown fewer and fewer innings per start over time, but it was a more gradual trend until recently. From 1999 to 2015, starting pitchers accounted for about 66 percent of the innings pitched in the major leagues and no season fell outside the range of 65 to 67 percent. This changed in 2016 and the decrease has continued over the last five seasons:
65%–2015
63%–2016
62%–2017
60%–2018
58%–2019
56%–2020
The advent of the “opener” plays a factor here, but it’s difficult to discern an “opener start” from a bad outing in which the pitcher was removed early, so we don’t know precisely how much of a factor.
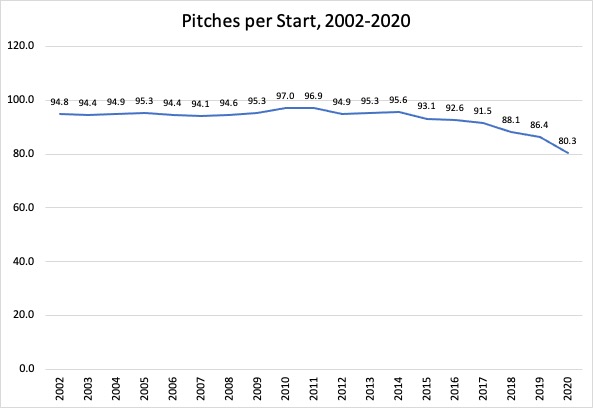
We can try to estimate the effect of the opener a couple different ways, although the 2020 season makes this more difficult. Along with the continued usage of the opener, the 2020 season was affected by the unusual schedule due to the pandemic. Pitchers ramped up in spring training for the season to begin in late March, then had to shut it down for a few months before ramping up again for the July start. The result was starting pitchers averaging just over 80 pitches per start, which was a significant drop from even the previous year. The chart below shows the decrease in the average number of pitches per game thrown by starting pitchers since 2002.
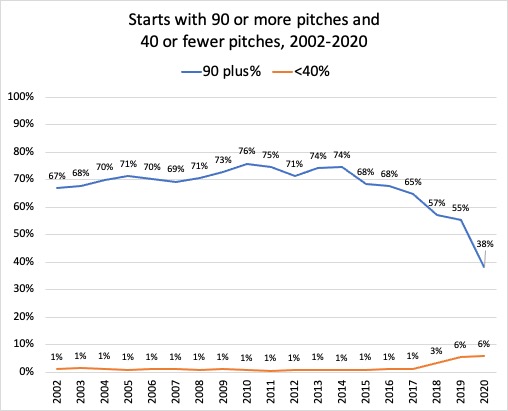
Because it’s difficult to pinpoint exactly how much of this decrease in innings pitched per start is due to the opener, we can instead look at some related numbers. For example, from 2002 to 2017, starting pitchers threw 90 or more pitches in 65 percent of their starts. That dropped to 57 percent in 2018, 55 percent in 2019, and, most dramatically, 38 percent in 2020.
This drop in starts with 90 or more pitches coincides with an increase in starts with 40 or fewer pitches (a rough proxy for starts by an opener). Before the advent of the opener, these starts were almost exclusively games in which pitchers were knocked out early or injured. From 2002 to 2018, about 1 percent of starts each year were from pitchers who threw 40 or fewer pitches. In 2018, this increased to 3 percent of starts, likely due to the use of the opener. In 2019 and 2020, it was 6 percent of starts, as the opener became more prevalent.
In recent history, the 2018 season was significant. It was the first year in which the percentage of complete games dropped below 1 percent. It was also the first year of a steep decline in the number of starts with 90 or more pitches, along with an increase in starts with 40 or fewer pitches, which combined to make it the first year in which pitchers averaged fewer than 90 pitches per start. This was due to the effect of new managerial strategies, which included the use of the opener along with removing pitchers earlier from games to avoid the “three times through the order” penalty (on average, pitchers are less effective each time they face a batter, so non-elite starters, and occasionally Blake Snell, are increasingly removed from games before they face the lineup a third time).
If we assume that a similar 1 percent of pitchers are leaving games early because of poor performance or blowouts, based on the history going back to 2002, that leaves 5 percent of these shortened starts in the realm of the opener in each of the last two seasons. That being said, there wasn’t an increase from 2019 to 2020 in the percentage of starts with 40 pitches or fewer, but there was a significant decrease in starts with 90 or more pitches. This suggests that it wasn’t just the use of the opener that led to the dramatic decline in pitches per start. It was likely some combination of managerial strategy (removing pitchers earlier than in the past) and the effects of the pandemic (pitchers weren’t ready to pitch 90 or more pitches because of the disjointed season).
All of these factors have come together and resulted in a significant decrease in the gap between the ERA of starting pitchers and relievers. In the 40 seasons before 2018, the average difference in ERA between starters and relievers was 0.33. This held true as recently as the 2017 season, when the difference was 0.34. In 2018, it dropped to 0.11. In 2019, it dropped again, to 0.08.
Then came the 2020 season, when starting pitchers had an ERA of 4.46 and relievers had an ERA of 4.44. They were almost equal. The last season in which the difference in ERA between starters and relievers was this small was 1970 and that was a far different time. That year, Gaylord Perry led baseball with 328 2/3 innings and completed 23 of his 41 starts, numbers that are unimaginable today.
It’s possible that the bizarre 2020 season contributed to the very small difference in ERA between starters and relievers, but the trend was already in motion. We’ve seen the decrease in innings pitched per start and fewer 90-start outings, along with the increased usage of relievers overall. This could be the tipping point, though. It’s possible that MLB has just about reached an equilibrium between starters and relievers (we’ll know more if we get a 162-game season in 2021).
Going forward, if starting pitchers, as a group, begin to have a lower ERA than relievers, that could be a sign that the trend of shifting innings from starting pitchers to relief pitchers has gone too far. The whole point of removing starting pitchers earlier than in the past is to prevent runs from scoring by bringing in a more effective pitcher. If we get to the point where starting pitchers have better ERAs than relievers, then managers may need to let their starters go longer or they’ll have erred in the other direction.


