Corbin Burnes, Mitch Keller, and the Road Not Taken
“Two roads diverged in a yellow wood, And sorry I could not travel both”
– Robert Frost in The Road Not Taken
In 2019, Pittsburgh Pirates right-hander Mitch Keller pitched 48 innings with a 7.13 ERA, 3.19 FIP, and 3.47 xFIP (FIP with a normalized home run rate). FIP and xFIP estimate a pitcher’s run prevention independent of the performance of their defense. Keller was quite good at the two things a pitcher has the most control over—strikeouts and walks—and had a better than average rate of home runs per fly ball. He struck out 29% of the batters he faced, walked 7%, and had a 13% HR/FB rate. The NL averages were 23% K%, 9% BB%, and 15% HR/FB rate.
The biggest problem for Keller was a .475 Batting Average on Balls In Play (BABIP) and 60% Left On Base percentage (LOB%). Most major league pitchers have a tendency to have their BABIP-allowed and LOB% regress to league average.
BABIP is a metric than can fluctuate greatly from year to year even for the best pitchers in baseball. Peak Pedro Martinez is a great example of this. He put up incredible numbers from 1999 to 2001, with his 1999 and 2000 seasons being among the best pitching seasons of all-time. For his entire 18-year career, Pedro had a .279 BABIP-allowed, but right in the middle of his peak years, he had two seasons with BABIPs over .300. He actually struck out a higher rate of batters in 1999 and 2001, but had a BABIP in 2000 that was 70 points below the surrounding seasons.

Despite Mitch Keller being better than average in strikeouts, walks, and home runs per fly ball rate in 2019, he was knocked around for a .475 BABIP that was 180 points above the NL average and his 60% LOB% was 13% below the NL average. It just didn’t compute. How could a pitcher who was above average in strikeout rate, walk rate, and HR/FB get knocked around for a .475 BABIP? In fact, Keller’s .475 BABIP was the highest ever for a pitcher with 40 or more innings in a season and it’s not particularly close. Second on the list is 2016 Trevor Rosenthal, at .425, followed by 2007 Shawn Camp (.418) and 2019 Corbin Burnes (.414).
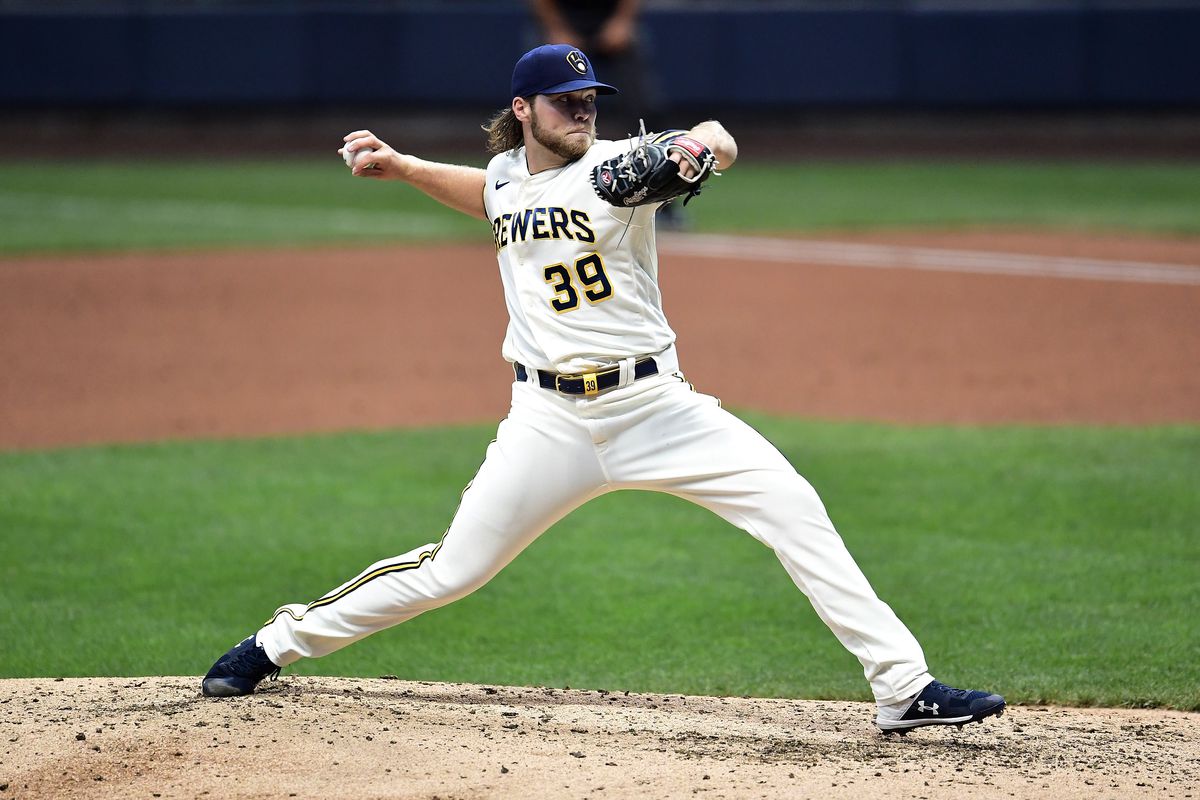
Wait, what? Corbin Burnes? The 2020 stud who had 88 strikeouts in 59 2/3 innings with a 2.11 ERA? The pitcher who finished sixth in NL Cy Young voting? That guy had a .414 BABIP-allowed in 2019? Yep, the 2019 version of Corbin Burnes shared some similarities, in both good and bad ways, with 2019 Mitch Keller. Consider the numbers:

Among the 191 National League pitchers with 40 or more innings in 2019, Burnes had the worst ERA and second-worst WHIP, while Keller had the fifth-worst ERA and worst WHIP. They both had above-average strikeout rates and near league-average walk rates, with Keller showing better-than-average control and Burnes worse. They shared sky-high BABIPS and very low LOB percentages. Keller was significantly better at avoiding the home run.
Their 2019 pitching performances weren’t all they had in common. After being drafted in the 2nd round of the 2014 June Amateur Draft, Keller was on the Baseball America top-100 list four straight years from 2017 to 2020, peaking at #12 prior to the 2018 season. Burnes was drafted in the 4th round of the 2016 June Amateur Draft and twice appeared on the Baseball America top-100, peaking at #46 prior to the 2019 season.
On the surface, the 2019 season looked disastrous for both pitchers, with those inflated ERAs and WHIPs, but the underlying metrics—like the aforementioned strikeout and walk rates—looked pretty good. Rather than focus too much on their 8.62 and 7.13 ERAs, baseball fans with a more analytical bent looked at their 3.37 and 3.47 xFIPS and saw potential for significant improvement. Whatever happened in 2020, it would be very unlikely for either of these pitchers to have another season with a .400+ BABIP-allowed.
With these underlying metrics in mind, the Steamer projection system, which can be found at FanGraphs, projected both pitchers to have much lower ERAs and WHIPs in 2020 than they had in 2019:

In the fantasy baseball world heading into the 2020 season, Keller had an average draft position at NFBC of 228, while Burnes checked in at 394.
So, what happened in 2020? Mitch Keller had a 2.91 ERA and 1.25 WHIP. Corbin Burnes was even better, with a 2.11 ERA and 1.02 WHIP. Well done, Steamer!
Except that doesn’t tell the whole story because one of these pitchers really did have a much-improved 2020 season while the other regressed mightily. This is where the “two roads diverged in a yellow wood…” and Corbin Burnes took the more impressive path.

Burnes really was a much-improved pitcher in 2020, which was reflected in his ERA, FIP, and xFIP all being under 3.00. While his walk rate increased slightly, from 9% to 10%, he greatly increased his strikeout rate, from 30% to 37%, and saw a huge improvement in his HR/FB rate.
As this detailed article at Pitcher List reveals, Burnes made substantial changes in his arsenal between 2019 and 2020, with the major change being a significant decrease in the use of his 4-seam fastball and an increase in the use of the sinker and cutter. He also added a changeup. There was real improvement, but also a bit of luck with a much lower BABIP and significantly lower HR/FB rate. Burnes was very good in 2020, but not really 2.11 ERA good.
Meanwhile, Keller most certainly was not improved, as his 6.75 FIP and 6.57 xFIP reveal. He was limited to five starts because of an oblique injury, but his strikeout rate dropped by more than 10% from 2019 and his walk rate almost tripled. He was actually worse in significant ways in 2020, despite that 2.91 ERA. He was very fortunate that the bad results in BABIP and LOB% in 2019 totally flipped in 2020, as he went from a record-setting .475 BABIP (highest ever for a pitcher with 40 or more innings in a season) to a record-setting .104 BABIP (lowest ever for a pitcher with 20 or more innings in a season). His LOB% improved from 60% to 94%.
In his final start of 2020, Keller’s results epitomized his season. He pitched five hitless innings, but walked eight batters and only struck out three. Over his final two starts of 2020, he pitched 11 hitless innings with 10 walks and nine strikeouts, which produced a 0.82 ERA, 4.56 FIP, and 5.96 xFIP over that span.
We’re still very much in small sample size territory with Keller’s career, but his results over the last two seasons would seem to make him one of the more difficult pitchers to figure out heading into the 2021 season. Steamer, which had very similar projections for Burnes and Keller prior to last season, is now projection their paths to diverge considerably in 2021:

In the fantasy baseball world, the average draft position for Burnes and Keller has also changed considerably. Keller went from being taken around pick #228 last year to #311 this year, while Burnes has skyrocketed up the charts from pick #394 last year to #60 this year.
It makes sense to expect Burnes to be better than Keller, but 330 picks seems excessive based on the results of an abbreviated season during a pandemic. Keller was a top prospect for a reason and the last two seasons have been incredibly bizarre, with that crazy fluctuation in BABIP and LOB%. Pirates pitching coach Oscar Marin is optimistic. Referencing Keller’s plan for better sequencing of his pitches and the benefits of a deeper dive into the data, Marin said, “He [Keller] has a good idea of what his identity should be and what it is.” Considering the tempered outlook for the Pirates this year, it would provide at least some joy to Pirates fans if Keller can take a better road in 2021.
-Bobby Mueller

