Thoughts and Trends on the Early MLB Season
It’s tough to write about early season baseball. I don’t envy professional writers at all this time of year. I’ve been blogging in one form or another for seven years now, and every April my enthusiasm for the start of the season is diminished slightly because what am I going to write about? Well, the league as a whole generates a lot of plate appearances quickly, so that’s something we can take a look at.
Let’s go for a walk
After staying at 8.5% from 2017-2019, the walk rate went up substantially last year to 9.2%. That might not seem like very much, but because of its effects on OBP and the fact that it’s a relatively low number, it’s a significant bump. Now it’s hard to take anything away from the 2020 season for multiple reasons: it was only 60 games, there were no fans in the stands, and the mental an emotional toil the pandemic took on players.
Right now, though, the walk rate is at 9.1% and it was as high as 9.5% a couple of weeks ago. If this continues throughout the season, it’ll be interesting to see what the potential causes could be. Maybe the umps are shrinking the strike zone. Or maybe hitters are becoming more patient at the plate. With actual hitting becoming more and more difficult, the walk might be becoming a more enticing way to get on base. Speaking of which…
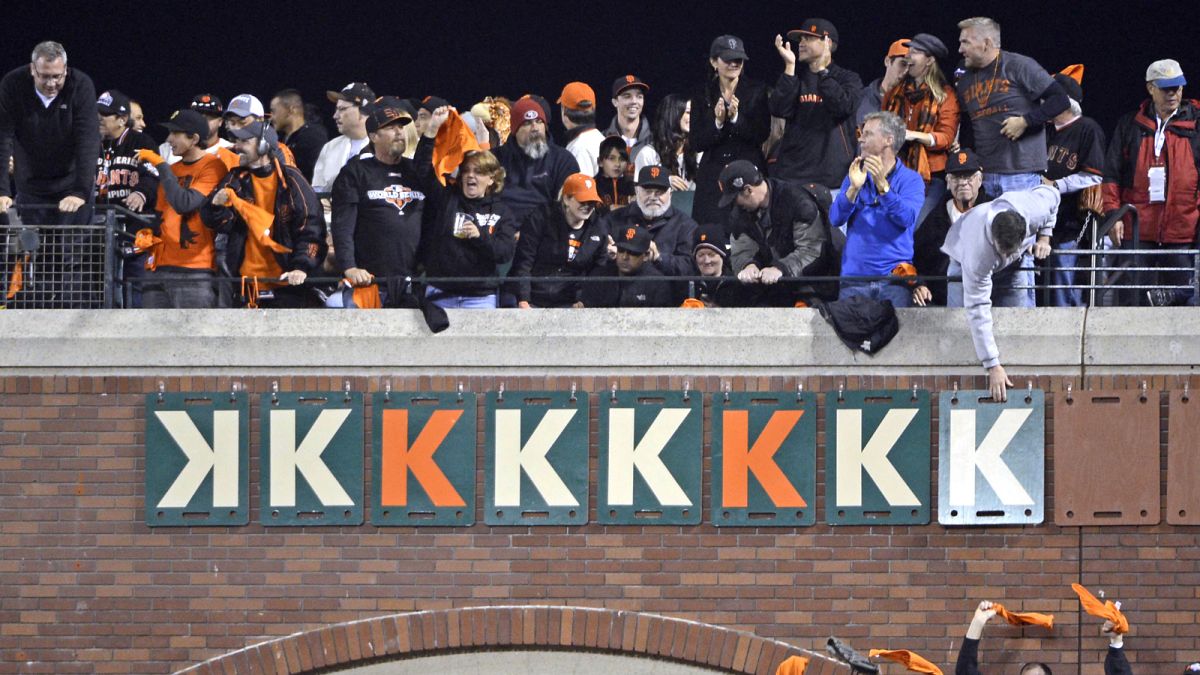
KKKKKKKKKKKK…
We are getting dangerously close to seeing a quarter of all plate appearances ending in a strikeout. At 24.5%, we are in the 17th consecutive season of strikeouts rising. That is over one percentage point higher than last year. Even though it’s only April, it’s probably safe to say that the league will once again break the record for highest strikeout rate for a season, and unless that number improves quite a bit, it will be the biggest year-to-year increase we’ve ever seen strikeout rate go up as a percentage of batters faced. Furthermore, you might’ve heard that 2018 was the first year that strikeouts outnumbered base hits.
My dear Jacob deGrom has struck out nearly half of batters faced. He is one of four starters with a strikeout rate over 40%, and one of 13 who have struck out at least a third of batters faced (at the time of this writing).
MLB’s idea to deaden the ball in hopes that hitters would adopt a more contact oriented approach is clearly not working, and I can’t say I’m surprised. It’s the pitching, stupid. Pitchers are throwing harder than ever. Breaking balls are coming in at velocities that you’d only ever see fastballs at once upon a time. If MLB really wants to solve the problem of strikeouts and lack of singles, they need to do something more drastic such as move the mound back. The Ringer’s Ben Lindbergh did an excellent job writing up the idea here. Another idea is to shrink the strike zone, like they did in the so-called steroid era. That did wonders for contact rates and offense.
As an experienced medicinal chemist, I’ve always found the smaller strike zone a far more plausible explanation for the high offense in that era as opposed to magic pills. We’ve seen some historically high home run rates in recent years, despite MLB’s strict testing, which leads me into…
Home Run rates
After home run rates shot up in 2019 and 2020 to 3.63% and 3.46%, respectively, it is currently down to 3.09% of all plate appearances. That’s pretty close to where it was in 2018 (3.02%). The first big jump we saw last decade was in 2016, going from 2.67% the year before to 3.04%. As you can see, we still haven’t gotten back to anywhere close to pre-2016 levels, and the current home run rates are likely to only keep going up as the weather warms.
It appears that MLB has succeeded in deadening the ball, but since contact rates keep getting worse, they also predictably succeeded in further lowering offense in the league. It’s at 4.34 R/G right now, down from 4.65 R/G last year and 4.85 R/G the year before.
I don’t have a clever transition to the next topic, so let’s just get into it.
BABIP is down
For all the randomness and and chaos present in the game of baseball, it is astounding that the league wide BABIP always hovers around .300. Last year, it dipped to .292, and it was even lower than that earlier in the season, as discussed in another excellent article by Lindbergh. Right now it’s at .284. BABIP is always lower in April, likely because of the weather. The aforementioned article I linked to did a great job covering all the possibilities, but also conceding that those reasons have limits and caveats.
If the season ends with another low BABIP, it might be possible to pinpoint why with a season-plus of data on hand. Now let’s expand BABIP and move on to…
Good ol’ fashioned batting average
The league wide batting average is only at .232, down seven points from last season and a whopping 20 points from 2019. Even with the increased walk rates, the league OBP is at just .310. Again, as with BABIP, it’s normal for batting average to go up as the season progresses. Still the league wide batting average from 2010-2019 was .254, and only dipped below .250 once in 2018. The last time the league average was below .240 was in 1968.
You might recognize that season as the Year of the Pitcher. The league responded by lowering the mound and shrinking the strike zone. I’ll love baseball no matter what, but if the trends outlined here reach a nadir at the end of the season, it might be in the best interests of the game to act, just like they did after 1968.

