The Best and Worst Players Over the Last 162 Games
In typical times, it’s very easy to look up what a player has done over the last calendar year at FanGraphs, which can be an interesting way to find surprisingly good or bad players split across multiple seasons. The “last calendar year” is one of the options on the FanGraphs leaderboard. This doesn’t work so well this year because of the shortened 2020 season. The “last calendar year” option takes us back to last May, when there was no baseball being played. As far as overall playing time is concerned, it ends up being more like “last half-season.”
Of course, where there’s a will, there’s a way. Based on my calculations, if we set the custom date range back to the 2019 All-Star break (July 9, 2019), teams will have played roughly 162 games as of May 2. Most teams had played around 88 games by the 2019 All-Star break, meaning they had 74 games left. Add another 60 games for the 2020 season and roughly 28 games for the 2021 season through May 2 and you get around 162 games. Using the custom date range of July 9, 2019 to May 2, 2021 creates a “basically last 162 games” leaderboard.
Position Players
So which MLB position player has the most WAR over the last 162 team games, per FanGraphs? Surprise, surprise, it’s Mike Trout, even though he only played in 123 games over this stretch (he didn’t play after September 7 in 2019). Trout also has the highest wRC+ among hitters, but his lead over Nelson Cruz is slim (182 to 179).
Here are the top 10 position players in WAR since the 2019 All-Star break (roughly 162 team games):
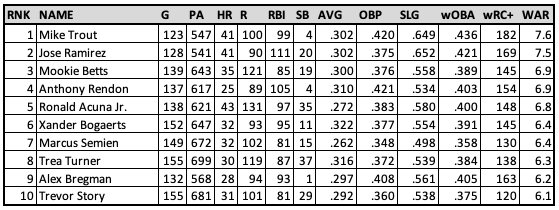
The guys at the top of the list are no surprise—Mike Trout, Jose Ramirez, Mookie Betts, Anthony Rendon, Ronald Acuña Jr., Xander Bogaerts. Then there’s Marcus Semien, checking in at seventh on this list. More on him in a few seconds. The bottom three are also top-tier players—Trea Turner, Alex Bregman, and Trevor Story.
Marcus Semien, though? Yeah, Marcus Semien. Much of his value over the last 162 games is driven by his scorching hot second half of 2019, when he hit .304/.396/.621 (168 wRC+). Since the beginning of last season, he’s hit .224/.304/.388, good for a 95 wRC+, which is 10 points below his career mark.
There are some surprising names that jump out from the list beyond the top 10. The ageless Nelson Cruz is 11th in WAR, all of it driven by his .324/.403/.665 batting line. Three spots below Cruz is Mark Canha, who has a .400 on-base percentage in his last 663 plate appearances. Mike Yastrzemski ranks 18th, two spots ahead of Aaron Judge. Perhaps no player in the top 30 is more surprising than Kyle Seager of the Seattle Mariners (ranked 21st). Over his last 157 games, dating back to the 2019 All-Star break, Seager has 30 homers and 105 RBI, while hitting .252/.339/.479 (123 wRC+, 4.9 WAR).
On the other end of the spectrum, we have the least valuable position players over the last 162 team games. I set the minimum plate appearances at 400 for the following “bottom 10” list.
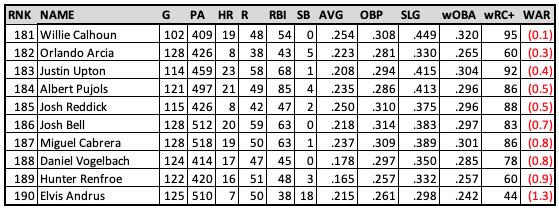
Remember that WAR includes offense and defense, so Willie Calhoun is in the bottom 10 despite being the best of this group on offense. Of course, his 95 wRC+ is still below average, but it’s higher than any of the other nine.
There are two Los Angeles Angels players in the top four (Trout and Rendon). Unfortunately, there are also two Los Angeles Angels players in the bottom 10: Justin Upton and Albert Pujols, who are making a combined $53 million this year. Both Upton and Pujols are below .300 in on-base percentage and they don’t make up the difference in slugging percentage or defensive value.
Josh Bell hit .302/.376/.648, with 27 homers and 84 RBI in 88 games during the first half of the 2019 season. That made him a National League All-Star. Since then, he’s hit .218/.314/.383, with 20 homers and 59 RBI in 128 games. Add in some very bad defense and you get a below replacement-level first baseman.
It’s a similar story for Daniel Vogelbach, who hit .238/.375/.505, with 21 homers and 51 RBI in 85 games during the first half of the 2019 season. Like Bell, Vogey was an All-Star. Since then, he’s hit .178/.297/.350.
At the very bottom of this list is Elvis Andrus, with a 44 wRC+ and -1.3 WAR over the last 162 team games. He’s been even worse in 2021. In his first 28 games of this season, he’s hitting .160/.206/.191 (14 wRC+). Compare that with the production that the A’s were getting recently from Marcus Semien (a top 10 player) and… Oakland, you have a problem.
Starting Pitchers
For starting pitchers, I set the minimum innings to 100 over the last 162 team games, but all of the top hurlers pitched well over that amount. It should be no surprise to see Jacob deGrom at the top of the leaderboard. Not only has he been the leader in FanGraphs WAR among pitchers, he’s also the overall leader, worth a full win more than Mike Trout. Our fingers are crossed that his right shoulder inflamation is the simple result of a bad night’s sleep, rather than the baseball gods leveling the playing field. Here are the top 10 starters:
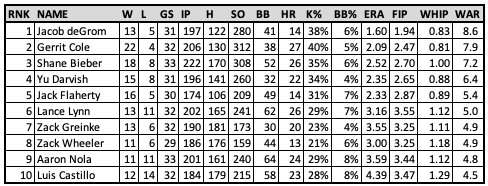
Over his last 31 starts, Jacob deGrom has a 1.60 ERA and 0.83 WHIP. Pretty incredible. Utter dominance. Bob Gibson-esque. The next two pitchers are no surprise—Gerrit Cole (312 strikeouts in his last 32 starts) and Shane Bieber (308 strikeouts in his last 33 starts). Yu Darvish has been very good since the 2019 All-Star break, as has Jack Flaherty.
Lance Lynn, sitting at 6th on this list, may be the first big surprise to fans who didn’t pay any attention to the Texas Rangers over the previous two seasons. Lynn is with the White Sox now, so perhaps he’ll get more recognition. Zack Greinke just continues to get batters out despite a sub-90 mph fastball. The top-10 list is rounded out with a pair of Phillies and a Red. Do Phillies fans realize Zack Wheeler has been as good as Aaron Nola over the last 162 team games?
Not shown above are some surprising names: Dylan Bundy ranks 15th and Charlie Morton ranks 16th despite ERAs of 4.13 and 4.45 during this time period. This is due to the fact that FanGraphs WAR is based on Fielding Independent Pitching (FIP). Bundy’s FIP is 3.56 and Morton’s is 3.13, which bumps up their value at FanGraphs.
Now for the bottom 10 starting pitchers (minimum 100 innings pitched and more than 40% of their appearances as a starting pitcher):
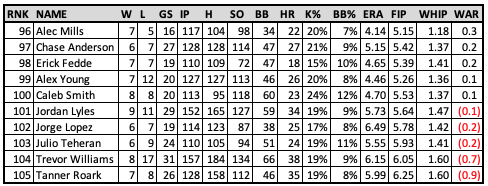
As mentioned above, the FanGraphs WAR metric is based on FIP rather than ERA, which is important to keep in mind when you see Alec Mills on this list. His FIP is a full run higher than his actual ERA. Mills threw a no-hitter in 2020. Despite that gem, he still makes this undesirable list.
There are three other pitchers—Erick Fedde, Alex Young, and Caleb Smith—who have ERAs under 4.75, but FIPs over 5.25. They would likely fare better with Baseball-Reference WAR.
At the very bottom of the list is Tanner Roark, who is going on a full 162 team games covering 26 starts with an ERA around 6.00 and a WHIP of 1.60. The same is true for Trevor Williams, whose ERA is exactly 6.00 in six starts this season, with a 1.74 WHIP.
Relief Pitchers
For relief pitchers, I used a minimum of 40 innings. FanGraphs WAR doesn’t care about wins or saves, so the top relief pitchers are not necessarily the top closers. There are middle relievers and setup guys who are more valuable than many closers. Here are the top 11 relief pitchers over the last 162 team games:
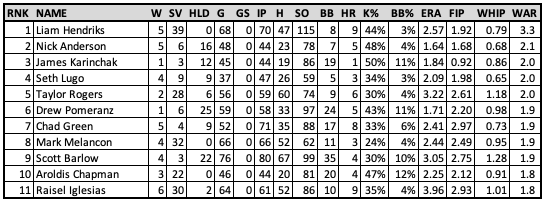
With a 2.57 ERA, 1.92 FIP, and 0.79 WHIP over 70 innings, Liam Hendriks has accounted for more than a full win of value over the next reliever on this list, Seth Lugo. Hendriks is one of five closers in the top 11 relievers, along with Taylor Rogers, Mark Melancon, Aroldis Chapman, and Raisel Iglesias.
The other relievers have a scattering of saves, along with some holds to go with their good ERAs and WHIPs. James Karinchak stands out for his 0.92 FIP and incredible 50 percent strikeout rate over his last 44 innings. Nick Anderson has struck out 48 percent of the hitters he’s faced. Aroldis Chapman is still bringing the gas and striking out hitters in 47 percent of their plate appearances against him.
We’ll finish this off with the bottom 10 relievers over the last 162 team games.
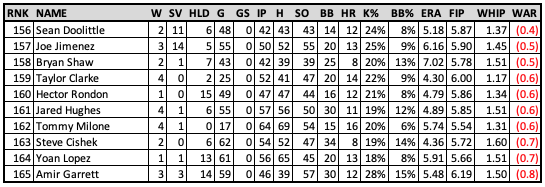
Avert your eyes, Cincinnati Reds fans because Amir Garrett is at the very bottom among relievers in FanGraphs WAR since the 2019 All-Star break, with a 5.48 ERA, 6.19 FIP, and 1.50 WHIP. Another Reds reliever, Sean Doolittle, has also been below replacement-level over this stretch. Both of these guys have really struggled with big flies. Doolittle has allowed 2.6 home runs per nine innings over his last 41 2/3 innings. Garrett isn’t far behind, with 2.4 HR/9 in his last 46 innings.
-Bobby Mueller


