Checking in on the Mid-Season Projections
People like to predict things. There are political pundits who try to predict the outcomes of elections. There are movie fans who host Oscar parties where party-goers predict the winners. Weather forecasters are doing their own specific type of prediction. And, of course, the sports world is obsessed with predictions, from season-long previews to predictions of the outcome of a single game to predictions of a single play.
In the baseball world, both real and fantasy, predictions are made every year for how well individual players and teams will perform in the upcoming season. Many fans think about this from a fantasy baseball perspective, but it’s not limited to fantasy. Major League teams are doing the same thing fantasy baseball participants are attempting to do: predict what players will do in the future.
Unless you work in the analytics department of a major league team, you don’t know exactly how teams are going about this process. Every team likely has their own “secret sauce.” The rest of us have projections to consider, some of which are freely available and some of which you have to pay for.
FanGraphs has a host of pre-season and in-season projections, including ZiPS, Steamer, ATC, THE BAT and THE BAT X. They also have an option that combines ZiPS and Steamer called Depth Charts. While they all have their differences, the core of any projection system is past information. The Godfather of projection systems are the Marcels, which were created by Tom Tango and are intended to be baseline projections—the basic framework of a model—the projections all the others should easily beat. Many other systems build off the Marcels, which use three previous seasons’ worth of statistics with specific weights for hitters and pitchers, along with regression to the mean and an aging component.
As you might imagine, the 2021 season was a particularly difficult season for which to generate projections, with the shortened 2020 season being a major confounding factor. Also, the nature of the baseball over the last few years makes every season a new adventure. Consider the MLB hitting numbers from 2018-2020:
- .248/.318/.409, 18.1 HR/600 PA—2018
- .252/.323/.435, 21.8 HR/600 PA—2019
- .245/.322/.418, 20.8 HR/600 PA—2020
There was a jump in all three rate stats (batting average, on-base percentage, slugging percentage) and a big jump in home runs from 2018 to 2019. That was a record-setting year, when MLB hitters launched 6,776 homers, beating the 2017 record by 671 dingers. This was primarily attributed to the change in the baseball.
The shortened 2020 season produced a similar on-base percentage as 2019, but it came with a drop in slugging percentage and home run rate (20.8 HR/600 PA). Remember that the 2020 regular season was played from late July to the end of September, which is part of the season in which offense is usually higher than in April, May, and June, so those 2020 numbers are likely higher than they would have been over a full year.
As the 2021 season came around, MLB announced plans to alter the baseballs, which threw another wrench into the typical projection mechanism. The memo from MLB cited a lab report that found the new balls would fly 1-2 feet shorter on drives that went more than 375 feet. Of course, given the league’s history with the baseball, no one could really depend on this claim. There have been times in the past when the ball behaved very differently from the previous season and MLB claimed nothing at all had changed.
The combination of a shortened 2020 season, the lively ball of 2019, and the new ball in 2021 made projecting on statlines a difficult proposition this off-season. Now that we’ve passed the halfway point, we can see how this has played out so far. With this in mind, I found 525 hitters who had preseason projections from ZiPS, Steamer, and THE BAT. All of these players had projections from each source, so we’re using the same player pool.
These are the full-season 2021 pre-season projections from each source for this group of 525 hitters.
- .248/.316/.417, 19.5 HR/600 PA—ZiPS
- .250/.323/.430, 21.5 HR/600 PA—THE BAT
- .254/.329/.437, 21.9 HR/600 PA—Steamer
And this is what these hitters accomplished through roughly the halfway point of the season (statistics through July 2):
- .244/.320/.411, 19.6 HR/600 PA—525 hitters common to ZiPS, THE BAT, and Steamer
The pessimistic projections from ZiPS were closest to the actual results, while The BAT and Steamer were expecting more offensive production than these hitters provided. The offensive environment is always a big factor and has been influenced this year by the changes to the ball and, potentially, the early-season usage of sticky stuff by pitchers. Offense was particularly lifeless in April and May before surging (relatively speaking) in June, which coincided with the announcement of a crackdown on sticky stuff along with warmer weather.
Going forward, these three projection sources have adjusted their projections based on past information, resulting in the following rest-of-season projections. Note that some hitters are out for the rest of the year and no longer have projections, so the player pool has decreased to 502 hitters common to each source. Rest of season (ROS) projections as of July 3:
- .248/.317/.417, 19.7 HR/600 PA—ZiPS (ROS)
- .253/.325/.437, 22.2 HR/600 PA—THE BAT (ROS)
- .248/.324/.420, 20.2 HR/600 PA—Steamer (ROS)
ZiPS hasn’t changed much from their original pre-season expectations, while THE BAT is projection an increase in all three rate stats, from .250/.323/.430 in the pre-season to .253/.325/.437 over the rest-of-the-season. Steamer has dialed down their projections in all three rate stats, but is still projecting more offense than ZiPS.
Individual Hitters with the Biggest Changes
Some hitters have had big breakout seasons that have altered their projections in a major way going forward, while others have struggled mightily and seen their projections drop dramatically. For each of the three sources mentioned above, these are the five biggest gainers in wOBA and the five biggest droppers in wOBA (with a minimum of 200 plate appearances through July 2).
ZiPS Biggest Gainers:
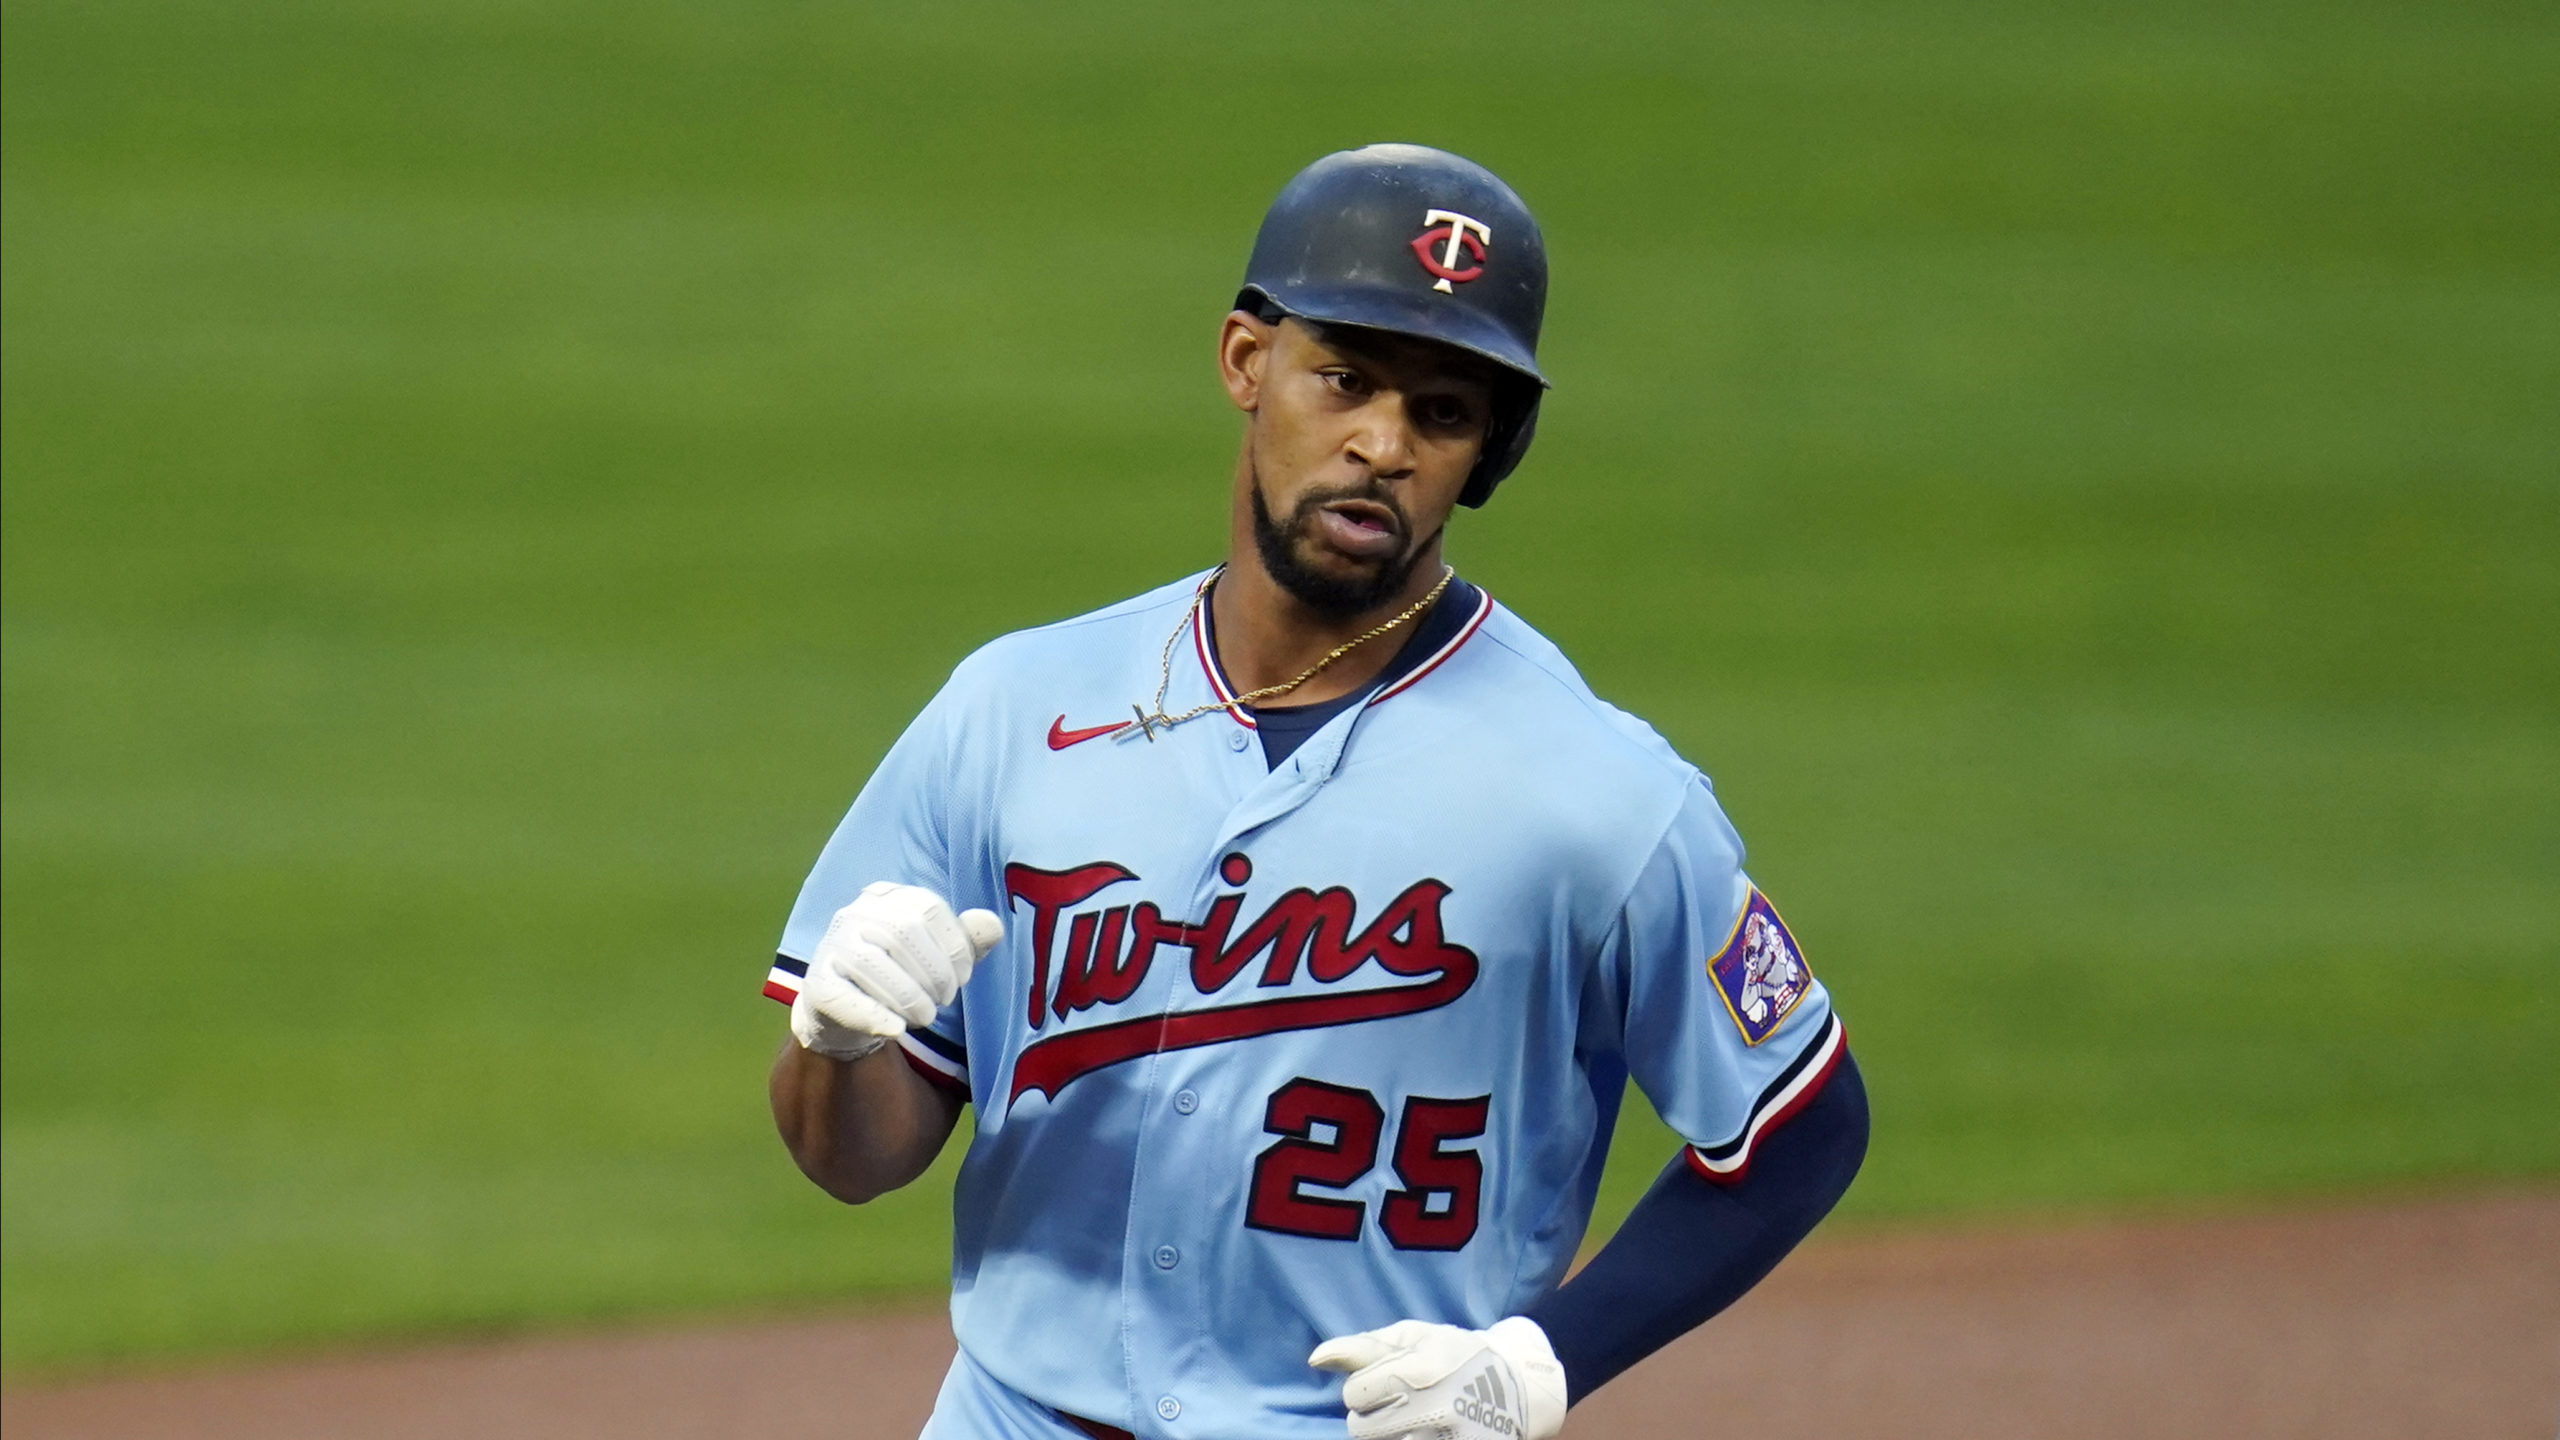
Vladimir Guerrero, Jr. is having the monster season everyone has been hoping for since he was the top prospect in baseball prior to his debut in 2019. Shohei Ohtani is doing things we’ve never seen before, with his combination of a league-leading home run total and a 3.49 ERA in 13 starts as a pitcher. Cedric Mullins II came into this season with a career .225/.290/.342 batting line, but scrapped switch-hitting and is threatening to be a 30-HR/30-SB guy. Akil Baddoo hit .214/.290/.393 in 29 games in High-A in 2019 before an elbow injury ended his season. The Detroit Tigers selected him from the Twins organization in the Rule 5 draft last December and he’s been their best regular hitter. Buster Posey opted out of the 2020 season and has come back a new man with a more potent bat.
THE BAT Biggest Gainers:
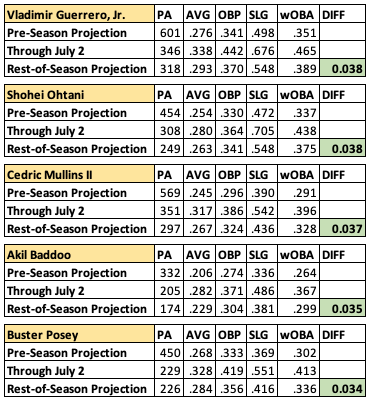
The Bat’s Biggest Gainers list also includes the aforementioned Cedric Mullins II, Shohei Ohtani, and Vladimir Guerrero, Jr., with the two new names being Adolis Garcia and Jared Walsh. Garcia has 21 homers and 59 RBI before the All-Star break, which no one would have ever imagined before the season started. Walsh had a huge 2019 season in Triple-A, hitting 36 homers in 98 games, but that was the year Triple-A used the MLB ball, which was quite lively. Walsh then hit nine homers in 32 games in 2020, but the projections were still skeptical. Now that he has 22 homers in 84 games, they’ve come around.
Steamer Biggest Gainers:
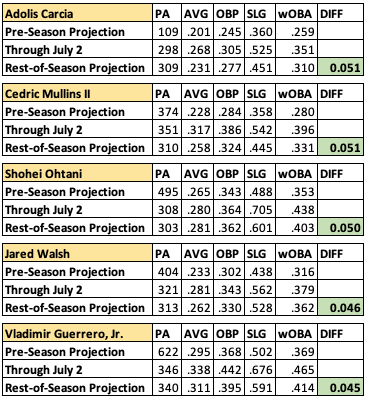
The unique player on Steamer’s list of Biggest Gainers is Andrew Vaugh, whose limited minor league track record led to a .216/.281/.352 pre-season projection. Vaughn was the White Sox 1st round pick in 2019 (3rd overall). He hit .241/.307/.421 in 72 games combined in Rookie ball, A-ball, and High-A. There were good reports on Vaughn coming out of the alternate site last season, but no data for a projection system to incorporate. After hitting .246/.317/.436 through the halfway point of the season, Vaughn is projected for more of the same from Steamer, giving him a projected bump in wOBA from .273 projection in the pre-season to .327 over the rest-of-the-season.
ZiPS Biggest Droppers:
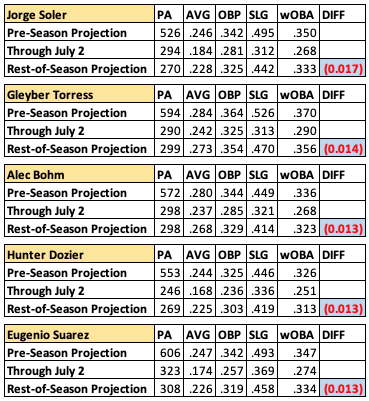
As you’d expect, this is a group of five of the most disappointing hitters in baseball. Years from now, some baseball fan will stumble across Jorge Soler’s Baseball-Reference page and be shocked to see that Soler hit 48 homers in 2019 before managing a .268 wOBA just two years later. After that Future Fan sees Soler’s B-Ref page, maybe they’ll go to Gleyber Torres next and see a guy who hit 24 homers in 123 games as a 21-year-old, then hit 38 homers in 144 games as a 22-year-old, then fell off a cliff at age 23. Torres slugged .511 in his first 1088 career plate appearances and has slugged .328 in his last 461 plate appearances. When Alec Bohm hit .338/.400/.481 in 44 games in 2020, he had a .410 BABIP. That was a red flag. His BABIP is .313 now, but he really should be better than this. Hunter Dozier and Eugenio Suarez are two of a dozen or so hitters with 200 plate appearances who are hitting below the Mendoza line. In the case of Suarez, at least he’s hit 16 homers.
THE BAT Biggest Droppers:
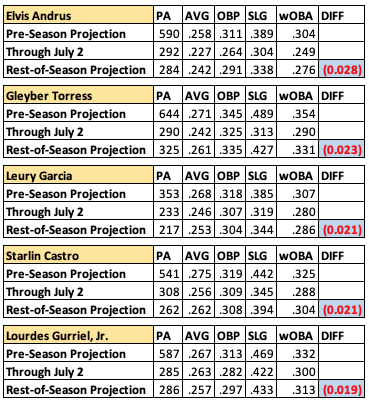
Gleyber Torres makes another appearance on a Biggest Droppers list. He’s the only player who made the top five for ZiPS, THE BAT, and Steamer. At the top of THE BAT’s Biggest Droppers list, we have Elvis Andrus, who was projected for a .304 wOBA in the pre-season, but is projected for a .276 wOBA going forward after hitting .227/.264/.304 (.249 wOBA) in the first half. Andrus was absolutely brutal in April and most of May. As of May 25, he was hitting .174/.219/.221 (.195 wOBA). Since then, he’s hit .298/.338/.426 (.329 wOBA), so perhaps he’ll out hit his rest-of-season projection from THE BAT. Leury Garcia pretty much is who we thought he was, only just a little worse. Sometime in the next few years, Starlin Castro is going to get his 2,000th career hit and baseball fans across the country will say, “What?” Lourdes Gurriel, Jr. is one of the few Blue Jays hitters who didn’t hit well in the first half.
Steamer Biggest Droppers:
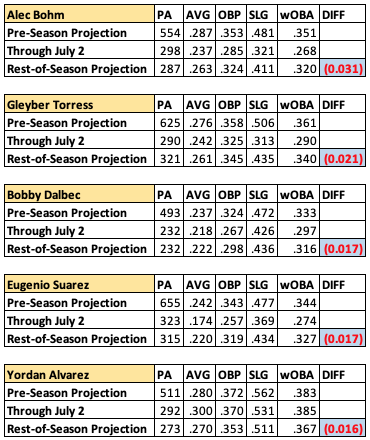
We’ve seen Bohm, Torres, and Suarez already, but Bobby Dalbec and Yordan Alvarez are new to the Biggest Droppers crowd on the Steamer list. Dalbec hit .263/.359/.600 in 92 plate appearances in 2020. That and his previous minor league numbers led to a .237/.324/.472 (.333 wOBA) pre-season projection from Steamer. Through July 2, Dalbec hit .218/.267/.426 (.297 wOBA) and his projection has dropped, as you’d expect. Yordan Alvarez is a surprise. He was projected to have a .383 wOBA in the pre-season and had a .385 wOBA through July 2, but is projected for a .367 wOBA going forward. At least one factor is that Steamer doesn’t believe in the .369 BABIP of Alvarez. If/when that comes down, Alvarez triple-slash numbers will come down with it. Still, a .367 wOBA is quite impressive.
-Bobby Mueller


