The 2021 Season in Triple-Slash Numbers
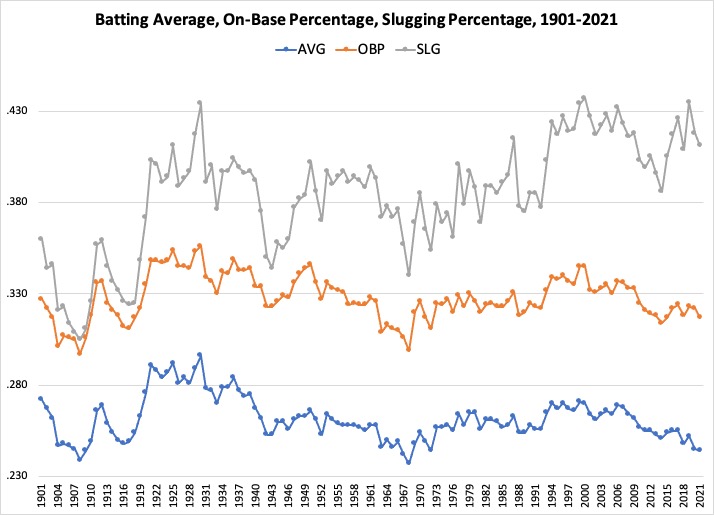
The utter lack of offense was a big story early in the 2021 season. Through the end of April, MLB hitters had a .232 batting average and .309 on-base percentage. There were six teams with a batting average under .220, including the Detroit Tigers, who were hitting .199/.257/.345 and striking out 30.6 percent of the time.
Offense picked up slightly in May, as hitters that month produced a .239/.315/.397 triple-slash (Batting Average/On-Base Percentage/Slugging Percentage), but the overall batting line in MLB through the end of the month was a triple-slash of .236/.312/.394. There had never been a full season with a batting average that low.
Hitting would pick up in June, but the 2021 season still finished with major league hitters producing one of the lowest leaguewide batting averages in the last 120 years, even considering shortened seasons. They were also well below average in on-base percentage. The triple-slash timeline shown below, is a big picture look at the trends we’ve seen in baseball since 1901.
With a .244 mark in 2021 and a .245 mark in 2020, the last two seasons had among the lowest leaguewide batting averages in MLB history (Negro Leagues not included). Only three seasons since 1901 had a lower batting average than the 2021 season—1908 (Deadball Era), 1968 (“The Year of the Pitcher”), and 1967 (The year before “The Year of the Pitcher”). The 2020 season also makes the bottom seven behind another Deadball Era season (1909) and the last season before the DH was added in the American League (1972).
115. 2020: .2446
116. 1909: .2438—Deadball Era
117. 1972: .2438—The last season before the DH was added in the American League
118. 2021: .2438
119. 1967: .2423—The year before “The Year of the Pitcher”
120. 1908: .2390—Deadball Era
121. 1968: .2367—”The Year of the Pitcher”
Historical Ups and Downs of Offense
After the onset of the Live-Ball era in 1920 and continuing into the late 1930s, the league-wide batting average was consistently in the .275 to .290 range. Batting average peaked in 1930 at .296, which is more than 50 points higher than the 2021 season. That was the year the entire National League hit .303. Four NL players topped the .380 mark, including Bill Terry at .401, which is still the last time a National League player hit .400. The closest anyone has come since is when Tony Gwynn was hitting .394 and the season ended in August due to a labor dispute.
Leaguewide batting average remained above .270 until 1940, then experienced a long stretch of years below that mark, bottoming out in 1968, at .237. After the addition of the DH in 1973, batting average remained above .250 every year until 2018, when it dropped to .248. There was a slight bump up to .252 in 2019 before it dropped again to .245 in 2020 and .244 in 2021.
These high-offense and low-offense eras have occurred for any number of reasons, including changes to the baseball, WWII, expansion, lowering of the mound, better fielding, and the introduction of smaller ballparks. More recently, pitches have increased their velocity and ability to strike out batters (possibly with the aid of foreign substances), which has greatly contributed to lower batting averages.
The baseball has been tweaked over the years, sometimes overtly and sometimes covertly. We know that changes to the baseball made a difference way back in 1920, which is the demarcation line between the Dead-Ball era and the Live-Ball era. The baseball used during WWII was different than the seasons around the war because of war-time restrictions on materials that were used in the construction of the ball.
There was a bizarre surge in home runs and slugging percentage in 1987 that has yet to be officially explained, but the ball is the primary suspect. That season, slugging percentage increased from .395 in 1986 to .415 in 1987, then back down to .378 in 1988. Home runs went from 3,831 to 4,458 to 3,180. Wade Boggs was a single-digit home run guy with a career-high of eight in his first five years in the big leagues who suddenly hit 24 dingers in 1987, then back down to five the next season.
Analysts were also convinced changes were made to the ball in the middle of the 2015 season after players combined to hit .251/.314/.386 in 2014 and .253/.314/.396 in the first half of 2015. The commissioner’s office denied any changes were made to the ball during that season, but after players hit .256/.320/.415 in the second half of 2015 and subsequent analysis was done, it seems more likely than not that something was up with the ball. MLB later acknowledged something had changed with the ball.
That change in 2015 led to an increase in offense, particularly home runs and slugging percentage, over the next few seasons, but the last two seasons have come down from the recent high-water mark of 2019 (.252/.323/.435—second-highest slugging percentage in MLB history). Of course, there was also a pandemic going on over the last two seasons, which we’re still trying to determine the effect of, so it will be interesting to see where offense goes in 2022.
Near record-low number of .300 hitters in 2021
Just thirteen players with enough plate appearances to qualify for the batting title hit .300 or better in 2021. It wasn’t the fewest number of qualifying .300 hitters in MLB history, but it was near the bottom, and none of the seasons with fewer .300 hitters had the current allotment of 30 teams. When adjusted for “.300 hitters per 30 teams” the 2021 season ranks 120th out of the 121 seasons since 1901.
Only 1968, the aforementioned season known as “The Year of the Pitcher” had fewer .300 hitters per 30 teams than last season. That year, just six players in a 20-team league hit at least .300, including Carl Yastrzemski, who famously led the AL with a .301 batting average. Five NL players eclipsed .300 that season, with Pete Rose leading everyone, at .335.
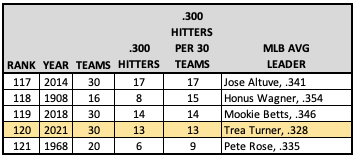
Another interesting fact about batting average in 2021 is that the AL and overall batting average leaders had among the lowest league-leading averages in the last 50 years. In the American League, Yuli Gurriel won the batting average title with a .319 mark. The last time the AL leader had a league-leading batting average lower than .319 was in 1972, when Rod Carew led the AL with a .318 batting average. The DH was put into place in the AL the following year because of the low level of offense in the American League. Trea Turner led the major leagues with a .328 batting average in 2021. The last time the MLB-leader had a batting average lower than Turner was in 1963, when Tommy Davis hit .326 to lead all players.
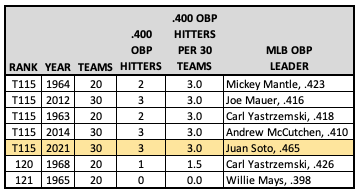
Soto, Harper, and Vlad—the only .400 OBP Hitters
The last two seasons have also been on the lower end of OBP seasons in MLB history, with 2021 ranking 105th out of 121 seasons and 2020 ranking 88th. The 2021 season, in particular, had a very low number of hitters with an on-base percentage of .400 or higher and enough plate appearances to qualify for the batting title. Only three players bested the .400 OBP mark—Juan Soto (.465), Bryce Harper (.429), and Vladimir Guerrero Jr. (.401). This paucity of .400 OBP guys led to the 2021 season ranking in the bottom 20 over the last 121 years in raw number of .400 OBP hitters.
On a “per 30 teams” basis, 2021 tied with four other teams for 115th place out of 121 seasons. The two seasons with fewer .400 OBP hitters per 30 teams were 1968 and 1965. Once again, “The Year of the Pitcher” shows up on a low-offense list. Carl Yastrzemski was the only hitter to top .400. In 1965, not a single qualifying hitter reached the .400 OBP mark. Willie Mays came the closest, with a .398 OBP.
As for slugging percentage, 2021 was a well above average season when it came to hitting for power. Batters collectively had a .411 slugging percentage, which ranked 25th over the last 121 seasons. It’s important for hitters to keep that slugging percentage up because the modern game has to rely on hitting for power to score runs when players aren’t hitting for average or getting on base like they used to.
Where the 2021 season ranked among the last 121 seasons (1901-2021):
Batting Average: .244 (118th)
On-Base Percentage: .317 (105th)
Slugging Percentage: .411 (25th)
What About the Sticky Stuff?
One of the biggest stories of the 2021 season was the crackdown on pitchers using illegal substances. MLB initially announced during spring training that there would be more scrutiny on pitchers this season, but there was little noticeable change in April or May. Then it was reported in early June that enforcement would begin on June 21, with “any player who possesses or applies foreign substances to the baseball” being automatically ejected and suspended for 10 games. The first pitcher suspended was Hector Santiago of the Seattle Mariners, who was tossed from a game in late June. In August, Caleb Smith of the Diamondbacks got the hook for possessing a foreign substance on his glove.
If we use June 21 as the dividing line, we can see there was an noticeable increase in offense post-sticky stuff enforcement, with batting average and slugging percentage increasing more than on-base percentage. Of course, we have to remember that offense is typically down in April and May compared to June, July, and August. When we look back at the last few full seasons, we can see the same general trend of an increase in offense from June 21 to the end of the season.
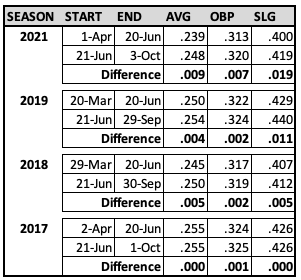
Compared to the last three full seasons, the 2021 season saw a bigger increase in offense across all three triple-slash numbers after June 21, which could be at least somewhat due to the crackdown on sticky stuff. We don’t know how much of an effect it had, though, because there are always other factors involved.
The liveliness of the baseball has seemingly shifted from season to season recently, with a livelier ball in 2017 and 2019 than in 2018 and something in between in 2020 and 2021. It seems as if MLB is still trying to work out the best core characteristics of the baseball while at the same time experimenting with tackier baseballs that will remove the incentive for pitchers to use illegal substances.
The 2022 season will give us more information about how offense is trending as we move away from the height of the pandemic, learn more about the effectiveness of the sticky stuff enforcement, and potentially see changes to the tackiness and performance of the baseball. I think most fans would agree it would be better for MLB to have more balls in play, higher batting averages, and higher on-base percentages than we’ve seen lately.


