Fantasy Baseball Clues in the 2022 Hitter Projections
The foundation of preparing for a fantasy baseball season is projections, although you don’t have to play fantasy baseball to be interested in how the projection systems believe the players on your favorite team will perform in the upcoming season. If you’re a Toronto Blue Jays fan, for example, you may want to see what the various sources expect from Vladimir Guerrero, Jr. or Bo Bichette. Here’s an example of what you would see for those two young Blue Jays stars based on the projection sources I used for this article:
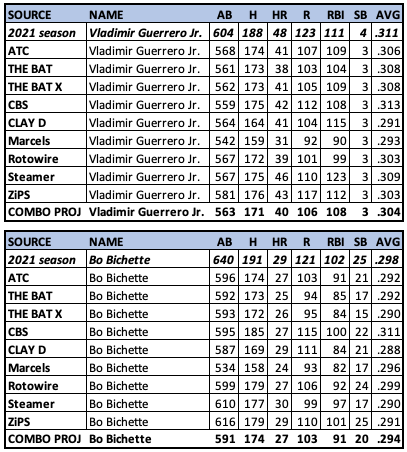
The bolded and italicized row on the above charts contains the statistics for that player in 2021. For example, Vlad tied for the league lead with 48 homers and led the league in runs scored, with 123, while posting a .311 batting average. The next nine rows show projections for Vlad in 2022 from assorted projection systems. His home run projections range from a low of 31 by Marcels to a high of 46 by Steamer. Marcels, by their nature, typically have conservative projections.
Before getting too far into the deep end on what the projections show for the upcoming season, let’s first take a moment to understand the projection systems available in the public sphere.
Projection Systems—A Primer
- Marcels—created by Tom Tango, Marcels is short for Marcel the Monkey Forecasting System. It is the most elementary forecasting system of them all. It uses three years of MLB data, with the most recent data weighted heavier. It regresses to the mean and has an aging factor. Many of the other systems build off the Marcels framework, using some number of years of data, with the most recent data weighted heaver, some regression to the mean, and an age factor. Then they add their own “special sauce.” Marcels projections are typically more conservative with playing time. Notice that Marcels projects fewer at-bats than the others for Vlad and Bo in the tables above.
- ATC—created by Ariel T. Cohen, ATC stands for Average Total Cost Projection System (while also conveniently being Ariel’s initials). It combines many other projections along with the player’s prior MLB statistics into a “composite” projection. It’s a “wisdom of the crowd” approach.
- THE BAT—created by Derek Carty, THE BAT is short for The How to Excel (at DFS) Baseball Algorithmic Tool. It starts as a comprehensive projection system like Marcels, then adds additional information for daily fantasy players, including platoon splits, role, lineup position, and more.
- THE BAT X—THE BAT X is like the 2.0 version of THE BAT, with the key advancement being the introduction of Statcast data. This includes variables like average launch angle, exit velocity, sprint speed, etc. Derek believes THE BAT X should be the best version of THE BAT, but until that is proven both versions are available.
- CBS—these are the projections from CBS Sportsline. I don’t know the background of these projections, such as who creates them or what kind of system generates the numbers.
- Clay Davenport—Clay Davenport co-founded Baseball Prospectus in 1996. Among other things, he crated Davenport Translations, which are estimated Major League equivalent performance statistics for minor league and international players. He is no longer affiliated with BP, but still runs his own website and creates projections each year.
- Rotowire—these are the projections from Rotowire. As with CBS, I don’t know the background of these projections.
- Steamer—created by Jared Cross, Peter Rosenbloom, and Dash Davidson, Steamer projections started with the basic Marcels framework and built upon it.
- ZiPS—created by Dan Szymborski, ZiPS is like Marcels and Steamer in that it uses a weighted average of past performance, but with four years for most hitters rather than three. It also identifies comparable players to create an estimate of future improvement or decline.
- ATC, THE BAT, THE BAT X, Steamer, and ZiPS projections can all be found at FanGraphs.
- The projections used for this article were gathered on February 8 and 9. Baseball Prospectus’s PECOTA system is set to be released today and would have been a good and welcome addition to this article.
The Big Picture—Projection Systems Comparison
Before we get to more individual hitter projections, let’s take a bird’s eye view of these projection systems. I found 265 hitters who had at least 100 at-bats in 2021 and have projections from all nine sources shown above. The top table among the charts below shows the composite stats for these players in 2021 (top row) along with their projections for 2022 from the various sources, with an average of all projections at the bottom. The table just below shows the data on a per player basis, with the difference between each source and the average of all projections shown in the table to the right.
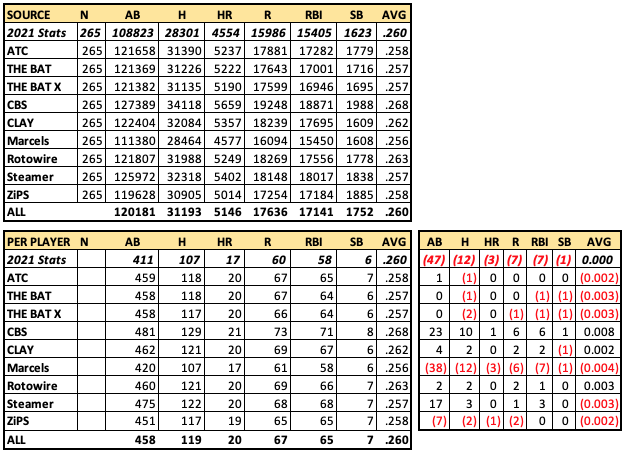
One thing to note is that THE BAT and THE BAT X use the playing time projections from ATC, although they are based on plate appearances, not at-bats, which is why they aren’t exactly the same above for these 265 hitters.
When all nine projection sources are averaged together, they produce the same .260 batting average that these players combined for in 2021. While that is true for the average of all the systems, the CBS projections are noticeably more optimistic in playing time—an average of 23 more at-bats per hitter—which leads to more projected hits, home runs, runs scored, RBI, and steals per hitter. They also project a .008 higher batting average than the average of all projections.
Clay Davenport and Rotowire projections are slightly higher in batting average than the average of the group, while Steamer projects more playing time but a lower batting average for these players. Marcels is the most conservative, as I alluded to above, projecting 38 fewer at-bats per hitter than the other systems and a .004 lower batting average for the group.
The batting averages for each system could be considered a proxy for the offensive environment the projections are expecting in 2022. This expected offensive environment makes a difference when you compare a player’s projections from different sources. For example, Bo Bichette is projected to hit .311 by CBS and .296 by Marcels. If you normalize all the projection systems to the average of the group, which is essentially putting them all in the same offensive environment, you could deduct .008 from each player’s CBS batting average projection and add .004 to each player’s Marcels batting average projection (so both sources would then project a .260 batting average for the group). With this adjustment, Bichette would be projected to hit .303 by CBS and .300 by Marcels. The original .015 difference in batting average shrinks to .003 when they are placed in the same expected run environment.
If you believe in the wisdom of the crowd approach, the simplest option would be to just use the ATC projections because they are a combination of other projections. If you prefer to do it yourself by picking and choosing from the projections you like most, then you should consider doing this step to normalize all the projections to the average of the group before averaging them together to get a final projection. In this case, it would mean subtracting 23 at-bats, 1 homer, 6 runs, 6 RBI, 1 steal, and .008 points in batting average from every player’s CBS projection, while adding 38 at-bats, 3 homers, 6 runs, 7 RBI, 1 steal, and .004 points in batting average to each player’s Marcels projection (and do this for the other sources as well).
Hitters With Consistent Projections
The players shown below are prominent players with among the most agreement from the projection sources on the statistics they’ll produce in 2022. This is after the adjustments mentioned above have been applied to put all the projection sources on a level playing field (same expected offensive environment).
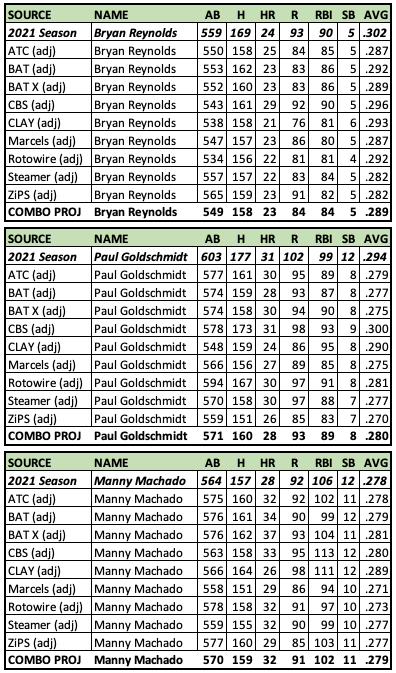
Bryan Reynolds is consistently projected to hit 22-25 homers with 4-6 steals and a batting average from .282 to .293, which is not far off from what he did last season. All of his categorical projections except for steals are just a little bit lower. CBS is a bit of an outlier with their projection of 29 dingers, while Clay Davenport projects him for 21 round-trippers and fewer runs scored and RBI than some of the others.
Paul Goldschmidt is projected for fewer stolen bases and a lower batting average than he had in 2021, along with slightly less production across the board than. He is going into his age-34 season, which usually indicates some decline at the dish is coming.
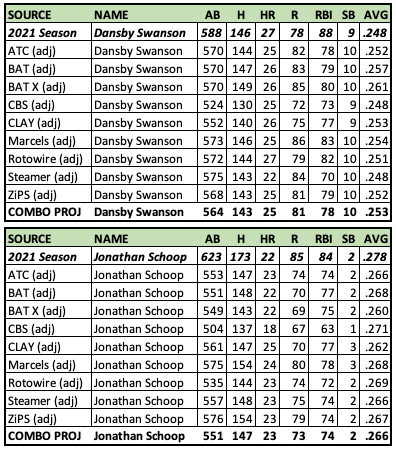
Manny Machado projects to be a 30-something HR guy with 10-12 steals in around 570 at-bats, which is pretty much exactly what he was last year. Dansby Swanson has a narrow range of projected home runs, from 22 to 27 from the nine sources, and they all have him with nine or 10 steals. Jonathan Schoop looks like a 22-25 HR bat with a batting average in the mid-to-upper .260s. Other players in this very consistent mold include Yasmani Grandal, Jean Segura, and Freddie Freeman.
Hitters With Least Consistent Projections
When it comes to the least consistent players, a big driver is playing time. The numbers are more scattered with these guys, whether due to recent injuries or uncertainty about their role in 2022. Once the owners end the lockout, there will be a flurry of moves that will shake up playing time situations all across the league and should ultimately bring more clarity to who is starting and who will be coming off the bench. Some of these projection sources will update their numbers when moves are made. For the time being, these are the players with among the least consistent projections in the group, in some cases because of one or two unusual outlier projections. Reminder, these are the projections after the adjustments mentioned above that equalize the run scoring environment.
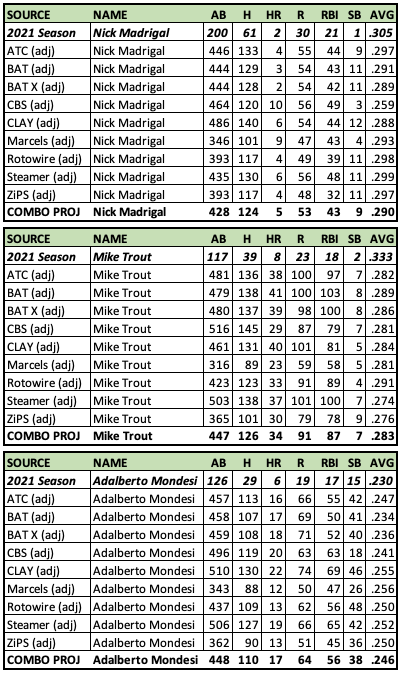
Nick Madrigal has a 140 at-bat gap between his Clay Davenport projection and his Marcels projection, with the other sources landing somewhere in between. There is also disagreement on his home run and stolen base ability. CBS has Madrigal launching 10 homers and stealing 3 bases, while THE BAT X sees him as a 2-homer, 11-steals guy. Considering that he’s hit just six home runs in over a thousand combined major and minor league plate appearances, projecting him to hit 10 this year seems a bit of a stretch. This isn’t the first time we’ll come across a curious CBS projection.
Mike Trout is coming off a season in which he had just 117 at-bats, which has led Marcels and ZiPS to project under 400 at-bats for 2022, while CBS has him with 516. The last time he had that many at-bats in a season was 2016. While CBS is high on playing time, their 29 projected home runs seem light for a guy who has averaged 34 homers per 516 at-bats in his career.
It’s not surprising to see Adalberto Mondesi with a high variance in his projections. What is surprising is seeing CBS project just 18 steals for Mondesi in 497 at-bats. Go home, CBS, you’re drunk. Mondesi has 56 steals in his last 497 at-bats, so you have to wonder why CBS is projecting such a low total for him.
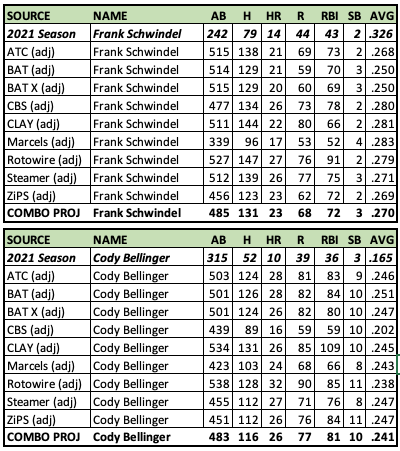
Is Frank Schwindel going to hit .250 with 20 homers and 70 RBI (THE BAT) or .279 with 27 homers and 91 RBI (Rotowire)? The projections don’t agree on the longtime minor leaguer who caught fire for the Cubs in a two-month stretch at the end of last season. Schwindel kicked around the minor leagues for seven years before missing all of the 2020 season because of the pandemic, then crushed it in AAA (.297/.337/.575) and the big leagues (.326/.371/.591) in 2021.
Finally, we have Cody Bellinger, who suffered through a truly ugly 2021 season. Most sources expect him to bounced back to roughly the player he was in 2020 (.239/.333/.455), but not the player he was in his career-best 2019 season (.305/.406/.629). While CBS is generally optimistic on the entire group of hitters, they are way down on Bellinger, projecting him to hit just .202, which is almost 40 points lower than the average of all the projections.
Other Notable Numbers
I went through each statistic to find the greatest and lowest standard deviations for a few hitting categories based on the projections from the nine sources. A greater standard deviation means those players have more dispersed projections compared to the mean. This is after the aforementioned adjustments to the projections have been made to put them in the same expected offensive environment.
At-Bats
- Greatest standard deviation in at-bats: Leody Taveras (ranges from 154 AB to 521 AB), Isiah Kiner-Falefa (293 to 612), Kevin Newman (250 to 533)
- Lowest standard deviation in at-bats: Jeimer Candelario (525 to 544), Manny Machado (558 to 578), Trea Turner (578 to 609)
Leody Taveras has a wide range of projections, from getting 154 at-bats with 5 homers and 7 steals according to Steamer to getting 521 at-bats with 17 homers and 22 steals according to ZiPS. The average of all projections for Taveras is 309 at-bats with 10 homers and 13 steals.
Isiah Kiner-Falefa is a teammate of Taveras on the Texas Rangers. He played in 158 games last year and had 635 at-bats, but after the Rangers signed Corey Seager and Marcus Semien in the offseason, Kiner-Falefa is not projected to get nearly as much playing time. Steamer has him with 293 at-bats, while ZiPS still has him with 612. The average of all projections is 442 at-bats.
Candelario, Machado, and Turner are being projected by every source to finish within a fairly narrow range of at-bats in 2022.
HR/500 AB
- Greatest standard deviation in HR/500 AB: Mike Trout (ranges from 27 HR/500 AB to 43 HR/500 AB), Michael Chavis (11 to 25 HR/500 AB), Cody Bellinger (17 to 31 HR/500 AB)
- Lowest standard deviation in HR/500 AB: Kyle Tucker (from 27 to 30 HR/500 AB), Cesar Hernandez (13 to 17 HR/500 AB), Austin Riley (28 to 31 HR/500 AB)
Trout and Bellinger’s adjusted projections were shown earlier. Michael Chavis joins then in this group thanks in large part to his CBS projection of 11 homers per 500 AB, which is well below the 24 HR/500 AB projected by ZiPS. Kyle Tucker had a rate of 30 HR/500 AB last year and is projected by every source to have 27-30 HR/500 AB this year. Call him consistent Kyle.
SB/500 AB
- Greatest standard deviation in SB/500 AB: Adalberto Mondesi (ranges from 18 SB/500 AB to 55 SB/500 PA), Jarren Duran (7 to 25 SB/500 AB), Starling Marte (28 to 44 SB/500 AB)
- Lowest standard deviation in SB/500 AB: Dansby Swanson (8 to 9 SB/500 AB), David Fletcher (9 to 10 SB/500 AB), Bryan Reynolds (4 to 6 SB/500 AB)
Adalberto Mondesi’s projections were shown earlier, so let’s look at Starling Marte here. He had a stolen base rate of 50 SB/500 AB last season. The average of all nine sources project him to drop to 33 SB/500 AB this year, but there is considerable variation. Steamer and Marcels have Marte with 28 SB/500 AB, while CBS has him nearly replicating last year, at 46 SB/500 AB.
Batting Average
- Greatest standard deviation in batting average: Eugenio Suarez (ranges from .201 to .244), Cody Bellinger (.202 to .251), Bryce Harper (.273 to .321)
- Lowest standard deviation in batting average: Yasmani Grandal (.235 to .241), Christian Walker (.250 to .255), Kyle Farmer (.255 to .261)
Eugenio Suarez’ .198 batting average in 2021 couldn’t even reach the famous Mendoza Line, but it came with a ridiculously-bad .224 BABIP. The projections universally agree that he should have better BABIP results this year, which should raise his batting average up to around .230 (the average of all nine projections, after adjustments, is .229). Two sources aren’t so sure about this, though. CBS and Rotowire have Suarez hitting .201 and .208, respectively, while THE BAT and THE BAT X project him to hit .244.
CBS, What Are You Doing?!
As I went through this exercise, the CBS projections repeatedly surprised me. They would definitely win in a competition of “one of these things is not like the other.” I’ve already noted the very low stolen base projection for Adalberto Mondesi, the low home projection for Mike Trout, the high home run projection for Nick Madrigal, and the very low batting average projection for Cody Bellinger.
Here’s another example with Brandon Belt. These are the unadjusted projections from the nine sources, along with the Belt’s 2021 stats and the average of all sources. Belt’s home run total and batting average projected by CBS leap off the page.
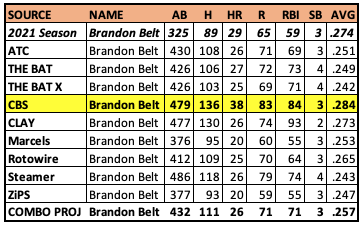
While most of the sources project Belt to hit 20-27 homers and put up a batting average generally in the .242 to .253 range, CBS has him with 38 dingers in 479 at-bats and a .284 batting average. Belt had a good year at the plate last year, hitting 29 homers in 325 at-bats, which works out to almost 43 homers in 479 at-bats, but one would think that the previous 10 years of his career would factor into the equation. Prior to last season, Belt averaged about 17 homers every 479 at-bats, with a .263 batting average. CBS is projecting him to more than double that home run rate and add about 20 points to that batting average, in his age-34 season. They might be leaning too heavily on his 2021 numbers.
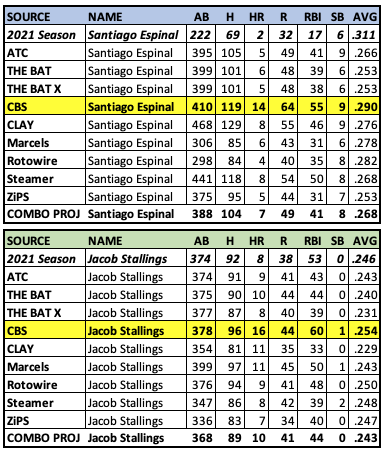
CBS is also projecting Santiago Espinal and Jacob Stallings to tap into some newfound power and batting average, as shown below. They really like Espinal, who is a third baseman for the Toronto Blue Jays for those who are unfamiliar. Stallings is a catcher with the Miami Marlins who hit a career-high eight home runs last season. CBS projects he will double that total in about the same number of at-bats.
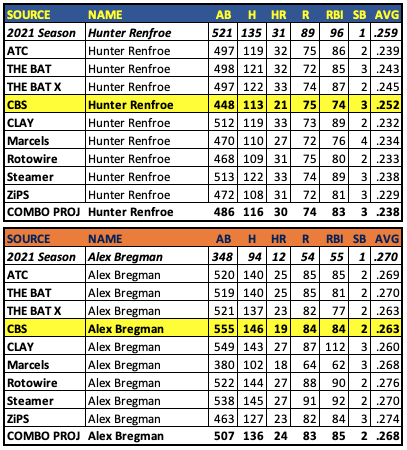
On the flip side, CBS is not a fan of Hunter Renfroe’s home run hitting ability, projecting him for just 21 homers while the other sources all have him with 27-33 big flies. They also have Alex Bregman with 19 taters in 555 at-bats, while most of the other projections have him with 23-27 in fewer at-bats than CBS is projecting.
Final Thoughts
I don’t know the exact mix of projections used by ATC, but a correlation check suggests they are more closely correlated with THE BAT, THE BAT X, Steamer, ZiPS, Marcels, and Rotowire than they are with Clay Davenport and CBS.
When it comes to playing time, Marcels and ZiPS have the highest correlation with 2021 for at-bats. Marcels and ZiPS projections are solely produced by the system, with no human adjustment for playing time. Steamer, Clay Davenport, and CBS have the lowest correlation with 2021 for at-bats.
This isn’t to say a high or low correlation to last year’s playing time is good or bad. It just is. Roles change and players who missed time get healthy, so adding the human element to predict playing time is a reasonable adjustment, rather than just going with what the computer spits out, especially when additional information unknown by the projection system is likely to play a factor. Humans may not be better than the algorithms at predicting home runs, steals, and batting average, but they should theoretically be better at predicting playing time.
Lastly, the Clay Davenport and, especially, the CBS projections stand out from the others. Good or bad, they are their own thing. They march to the beat of a different drummer. Some of the outlier projections from CBS are startling but, hey, let your freak flag fly, CBS projections.


