Another New Season, Another New Baseball?
One recent tradition for baseball fans is guessing what the ball will be like each year. Will it be lively? Will it be dead? Nobody knows. There was a time when the ball was an afterthought, but with the advent of Statcast data we can track exit velocity and hard-hit percentage, barrel rate and fly ball distance. If something strange is happening with the ball, we’ll hear about it pretty quickly these days.
So far this year, it appears something strange is happening with the ball. It’s early and there are a number of variables to consider, but there has been a noticeable drop in home runs per batted ball. Could it be the shortened spring training? Could it be the introduction of humidors to every ballpark? Could it be unseasonably cold weather this April? Some or all of those variables could be factors, but smarter people than me are pointing their fingers at the ball being different.
We learned at the end of last season that MLB used two different balls in 2021. Some of the balls were from the previous season, which had a higher home run rate, and others were created specifically for the 2021 season and were intended to reduce the home run rate, which it appears they did. In 2019, the home run rate per batted ball was 5.4 percent. In the shortened 2020 season, it dropped slightly to 5.3 percent. In 2021, with a mix of old and new balls, it fell again to 4.9 percent.
This season, through games on Monday, April 18, it’s all the way down to 3.9 percent. Again, the previously mentioned variables—shortened spring training, humidors, etc.—could be factors, but the drop in home run rate has been significant even in context. This tweet from Derek Carty on Monday morning showed data that suggests a change in the ball that included adjustments for weather, park, player quality, and the universal DH. Carty is an MLB/NFL Fantasy & Betting Analyst who created THE BAT projections for baseball and THE BLITZ projections for football. He knows some things.
In the replies to Derek’s tweet was more data from Max Freeze, who compared Statcast metrics for batted balls in April of 2022, 2021, 2019, and 2018. The trends for early this season show a drop in home runs per barrel percentage and a drop in wOBA on barrels. He suggests that balls are not traveling as far as they have in past Aprils given the same exit velocity and launch angle.
We’ll get more information as the season goes along, of course. In the meantime, I was curious how this seeming change in the ball is being factored into rest-of-season projections. Using three sources from FanGraphs—THE BAT, Steamer, and ZiPS—I compared the pre-season projections with the current rest-of-season projections (downloaded on Tuesday, April 19). The following statistics are for 358 hitters common to the three projection sources. I’ve taken the projections for the entire group of players and pro-rated them to 600 plate appearances to make the information more easily digestible.
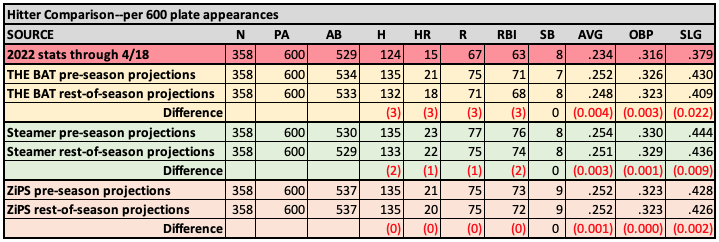
The top row shows just how poor offense has been in the early part of the season, with these 368 hitters combining to hit just .234/.316/.379. The other three sections show the projections from the three sources and how they’ve changed in just a week-and-a-half.
THE BAT projections are making the biggest adjustments by far. This group of players was projected to hit .252/.326/.430 before the season started. Now their group projection for the rest of the season has dropped to .248/.323/.409. This is more than just accounting for the lower statistics of the first part of the season (.234/.316/.379). This is making an adjustment for the 2022 scoring environment, with slugging percentage being dramatically down, likely because of the change in the ball.
Steamer has made a smaller adjustment that consists of a batting average drop from .254 to .251, a slight drop in OBP from .330 to .329, and a more substantial drop in slugging percentage from .444 to .436. The ZiPS projections are mostly unchanged, with just a slight drop in slugging percentage. Notably, ZiPS had the lowest projected on-base percentage and slugging percentage in the pre-season.
On a “per 600 PA” basis, THE BAT projects a drop from 21 homers to 18 for this group of players, while Steamer and ZiPS each project a drop of roughly one home run per 600 plate appearances.
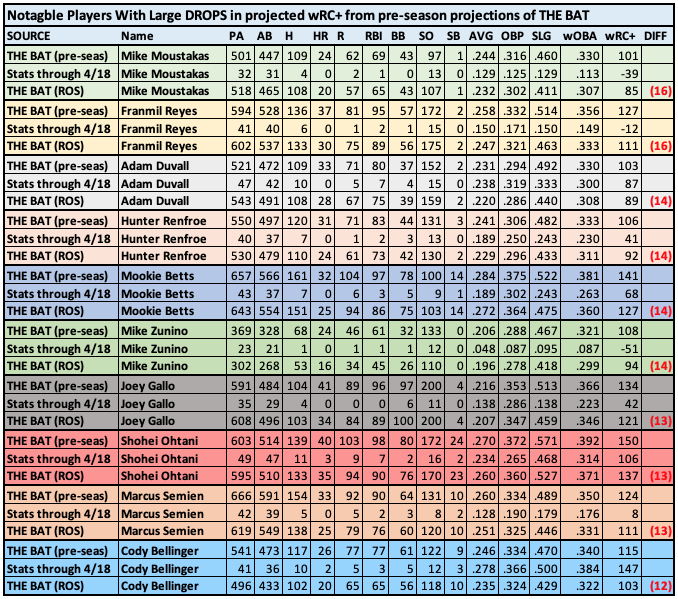
Notable Players With Large Drops in Their Projections from THE BAT
With THE BAT projections being the most affected by the potential change in the ball, I found a group of notable players projected by THE BAT who have seen their projections change for the worst since the pre-season, sorted by their drop in projected wRC+, a metric that is adjusted for league and ballpark effects and for which 100 is league average. For example, a wRC+ of 120 means a hitter is 20 percent better than average on offense. A wRC+ below 100 means that player is a below average hitter.
Most of these players are off to terrible starts. That and the change in offensive environment has resulted in a more pessimistic projection going forward. The one exception in this chart is Cody Bellinger, whose numbers look much better than last year, but who also has the highest strikeout rate of his career, what would be a career-high BABIP (.364, career BABIP is .284), and xBA and xSLG that are lower than his actual batting average and slugging percentage. He seems to be over-performing his batted ball data.
Many of the players on this list are big power guys, like Mike Moustakas, Franmil Reyes, Adam Duvall, Hunter Renfroe, Mike Zunino, and Joey Gallo. As such, they all have a significant decrease in their projected slugging percentage going forward (about 50 points), along with a sizeable decrease in on-base percentage (about 10 points). For some, like Moustakas, Duvall, Renfroe, and Zunino, the change in wRC+ drops them from slightly above average hitters to below average. Reyes and Gallo remain above average hitters by their projections, but with a drop in wRC+ by 16 and 14 points, respectively. Mookie Betts, Shohei Ohtani, and Marcus Semien are more well-rounded hitters than the others and all remain above average hitters even with their less-promising projections.
Notable Players With Gains in Their Projections from THE BAT
On the flip side, there are some players off to hot starts who have seen their projections improve for the rest of the season, albeit to a lesser degree because of the concurrent adjustment for the lower offensive environment. These five players are all off to very hot starts, including a player likely unknown to the vast majority of baseball fans just a couple weeks ago. That would be Owen Miller of the Cleveland Guardians, who was hitting .500/.545/.964 through Monday.
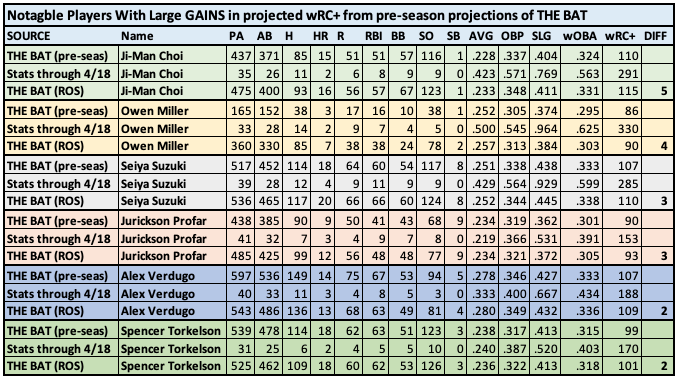
This group of players is more clustered around the 100 wRC+ mark than the previous group. Ji-Man Choi had the highest projection among these five players before the season started and has gained a bit on that after his hot start, jumping from a projected 110 wRC+ to 115 going forward. The aforementioned Owen Miller was projected to be below average and is still projected to be below average even with the improvement. The same is true for Jurickson Profar. Seiya Suzuki and Alex Verdugo were projected to be above average and each gain slightly after the first week-and-a-half of the season. Spencer Torkelson moves from a projected 99 wRC+ to 101, primarily due to an increase in on-base percentage.
We’ll see what happens going forward. Offense should pick up as temperatures rise; it always does. Still, if the ball continues to play the way it has so far, we’re in for a year with fewer home runs and less run-scoring overall than we’ve seen recently.


