Checking the Pulse of Baseball Two Months Into 2022
Offense Not As Offensive As You Might Think
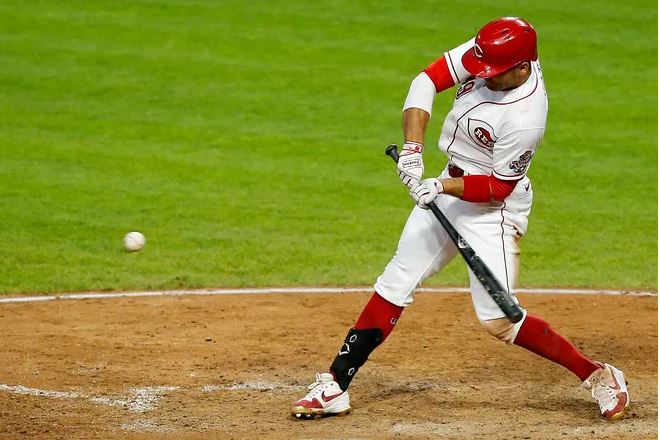
One of the running themes about baseball over the first two months of the seasons is that offense is way down, with a particular focus on fewer home runs flying out of the park. It’s true that home runs are down but, overall, offense is about the same as it was last year at this time. Consider the numbers through similar dates in 2022 and 2021:
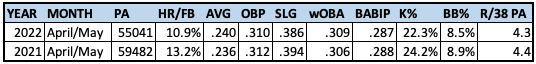
The rate of home runs per fly ball is down, that’s true, but batting average is slightly up, while on-base percentage and slugging percentage are slightly down. Hitters are striking out less often (the universal DH likely contributes to this) and walking less often. BABIP is very close, as is runs/game.
It’s interesting to look at how the 2022 season arrived at this point, as compared to 2021. Here are the breakdowns by month:
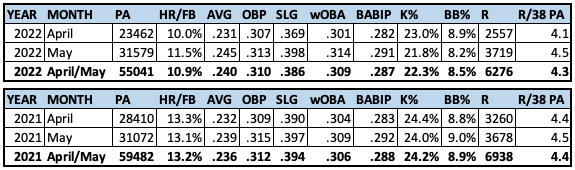
April was a rough month for hitters coming off the lockout and shortened spring training. Just 10 percent of fly balls went for home runs, league-wide BABIP was way down, and teams averaged around 4.1 runs per game (R/38 PA is a proxy). In the month of May, though, offense was essentially equal to May of 2021—similar on-base and slugging percentage, BABIP, and runs per game.
So where do we go from here? In 2021, offense increased from June 1 on, which is typical of every baseball season as the temperatures increase around North America. Last year also included the fresh new variable of MLB cracking down on sticky stuff used by pitchers. We also learned that two different groups of baseballs were used during the 2021 season, one group much livelier than the other. This was the result for 2021 from June 1 on:

Given past precedent, offense this year is likely to continue to heat up in June, July, and August, as it did in May. Of course, this season we have the added variable of humidors in every ballpark, which may reduce the rate of home runs in some ballparks early in the season while increasing the rate in July and August. We don’t know yet if that will happen, but it’s one theory. Check back in October.
April Slumpers Became May Thumpers
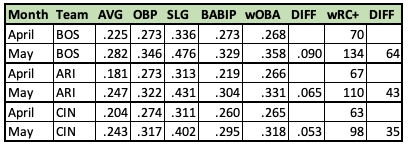
Regression to the mean is a powerful force and no teams exemplified it more than the Boston Red Sox, Arizona Diamondbacks, and Cincinnati Reds in the first two months of the season. Through the end of April, these three teams ranked 28th, 29th, and 30th in wOBA and wRC+, which are the best measures of offense in my humble opinion. (Think of wOBA as a better version of OPS. While OPS smushes together on-base percentage and slugging percentage in a fundamentally incorrect combination of ratios—different denominators—wOBA includes a wider array of offensive production and is set on a scale akin to OBP. wRC+ also incorporates a wider array of offensive production and is adjusted to the current run environment and ballpark effects and set on a scale where 100 is league average. Anything above 100 is better than average and anything below 100 is worse than average.)
In May, the Red Sox, Diamondbacks, and Reds saw their bats heat up significantly. The aforementioned slumpers in April and their thumping in May:
The Red Sox went from 28th in MLB in wRC+ to 1st, as their on-base percentage was up by 73 points and their slugging percentage 140 points higher. Two players who were already off to fine starts in April took it to another level in May. Rafael Devers went from a .293/.309/.467, 116 wRC+ April to a .381/.421/.712, 222 wRC+ in May. J.D. Martinez saw his production improve from .278/.344/.481, 133 wRC+ in April to a Ted Williams-like .406/.467/.604, 208 wRC+ in May.
The big story in Boston was Story, as in Trevor, who looked like an early-season bust in April and the first half of May. Through May 18, Story was hitting just .205/.293/.320, 77 wRC+. Then he busted out with a 3-HR, 7-RBI game against the Seattle Mariners on May 19, which instantly bumped his wRC+ to an above average 108. Including that game, Story has hit .265/.362/.735, 199 wRC+ since May 19.
Other improving Red Sox include Christian Vazquez (43 wRC+ in April, 166 in May), Bobby Dalbec (26 to 109), and Jackie Bradley Jr. (32 to 109).
For people who care about batting average the Arizona Diamondbacks were still hitting .199 as a team as late as May 12, but their much more important on-base percentage and slugging percentage had already started to improve. Overall, they had the second greatest difference in wOBA and wRC+ from April to May. The most dynamic of the Diamondbacks in May included Daulton Varsho (.211/.293/.394, 91 wRC+ in April; .301/.377/.527, 151 wRC+ in May), Christian Walker (.147/.229/.347, 61 wRC+ in April; .255/.354/.582, 155 wRC+ in May), and Ketel Marte (.146/.211/.256, 31 wRC+ in April; .363/.426/.538, 169 wRC+ in May).
Then there are the Cincinnati Reds, who infamously started the season by winning just three of their first 25 games. They’ve gone 14-10 since then, which is a better record than the Milwaukee Brewers, Toronto Blue Jays, San Francisco Giants, and San Diego Padres, among others. They went from the worst hitting team in baseball in April to around the middle-of-the-pack in May. In 12 games since returning from the IL, Joey Votto is hitting .250/.362/.575, a very impressive 153 wRC+.
Mighty Marlins
The Miami Marlins busted out the bats in Coors Field in a double-header on Wednesday, scoring 27 runs across both games, which is one more run than they had scored in their previous nine games combined. Their production in the double-header jumped them from 25th in baseball in runs scored through May 31 to 16th in runs scored through June 1. They also improved from 14th in on-base percentage to 10th, from 17th in slugging percentage to 11th, and from 16th in wOBA to 8th.
We’re still figuring out the narratives on the season. But week-to-week and month-to-month volatility seems likely to stick around.


