Evaluating RotoWire’s Weekly Two-Start Pitcher Rankings
For fantasy baseball managers in weekly leagues, utilizing two-start pitchers is one of the most important decisions to make each week. Managers have to take into consideration the caliber of pitcher, the pitcher’s team, the opponent, the venue, the weather, and the likelihood of the pitcher actually making the two starts scheduled for the upcoming week. Late in the season last year, I evaluated the two-start pitcher rankings from Clay Link and Todd Zola on the RotoWire Two-Start Pitchers podcast, which comes out on Fridays. Now that we’re past the All-Star break, it’s a good time to repeat the evaluation based on the first half of this season.
The RotoWire Two-Start Pitcher Podcast comes out on Friday and is focused on ranking the pitchers projected to make two starts the following week, along with some always interesting pre-ranking conversation between Clay and Todd. The duo is entertaining and informative beyond the two-start rankings and it’s a podcast I highly recommend.
Because baseball players, managers, and the weather can be unpredictable, not all of the pitchers they rank end up making two starts in the following week. Through the week ending before the All-Star Break, roughly 69 percent of these pitchers actually made two starts, 26 percent made one start, and five percent made no starts. That’s something to keep in mind when deciding whether to use a pitcher for a projected two-start week—only about 70 percent of them will actually make two starts.
When they give their rankings, Clay and Todd discuss each pitcher and ultimately settle on a number from 0 to 5, with a ranking of 5 essentially meaning “start in all leagues” and the lower numbers meaning “proceed with increased caution” as you move down from 5 to 4 to 3 and so on. A good rule of thumb is thinking of 4s and 5s as good starts, 0s and 1s as high-risk starts, and 2s and 3s as “on the fence.”
Clay and Todd have different views and different rankings, as you’d expect. Through the first 14 weeks, they agreed on their rankings 68 percent of the time, with a low of 48 percent during the week beginning May 2 and a high of 81 percent for the week beginning July 11. Also, it should be noted that Todd updates his rankings on Sundays, but for this analysis I am using the rankings from the Friday podcast. With that out of the way, let’s look at the results for Clay and Todd individually, starting with Clay.
Clay Link’s Results
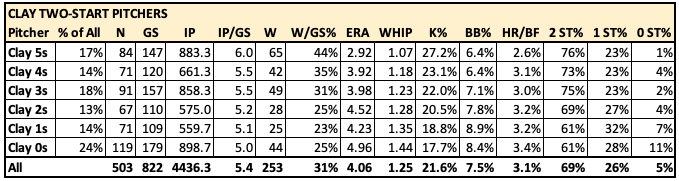
Almost without exception, Clay’s rankings follow the expected pattern where the higher the ranking, the better the result. Looking at innings pitched per games started (IP/GS), Clay’s 5s averaged six innings per start, his 4s and 3s averaged 5.5 innings per start, his 2s, 1s, and 0s, averaged 5.2, 5.1, and 5.0 innings per start, respectively.
The wins per games start percentage (W/GS%) follows a similar pattern, with his 5s earning wins 44 percent of the time, his 4s and 3s earning wins 35 and 31 percent of the time, and his 2s, 1s, and 0s, earning wins 23 to 25 percent of the time.
Except for one exception (Clay 1s), ERA and WHIP were better as the rankings were better, from a brutal 4.96 ERA/1.44 WHIP for Clay 0s to a superb 2.92 ERA/1.07 WHIP for Clay 5s. Starting a Clay 0 is a risky proposition that only the truly desperate managers should consider. You’re likely to hurt your ERA and WHIP, won’t get many strikeouts, and have a one in four chance for a win.
Continuing the pattern, these pitchers’ strikeout rate increased as you’d expect, from a 17.7 percent strikeout rate for Clay 0s to a 27.2 percent strikeout rate for Clay 5s, while their home run rate also followed the expected pattern decreasing from 3.4 percent HR/FB for Clay 0s to 2.6 percent HR/BF for Clay 5s.
Finally, the three columns on the right show how often each group of pitchers actually made two starts, with Clay 5s, 4s, and 3s making two starts 73 to 76 percent of the time, his 2s making two starts 69 percent of the time, and his 1s and 0s making two starts 61 percent of the time.
An Alternative Way of Using Clay’s Rankings
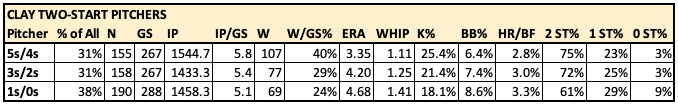
As an alternative to the 0 to 5 ranking scale used by Clay and Todd, I created two other ways to consider their rankings The first table below shows Clay’s two-start pitchers from the first half separated into three tiers, with his 5s and 4s combined together, his 3s and 2s combined together, and his 1s and 0s combined together. This method provides more distinct separation between the groups. It basically says, “start your 4s and 5s, bench your 1s and 0s, consider your categorical needs with your 2s and 3s.”
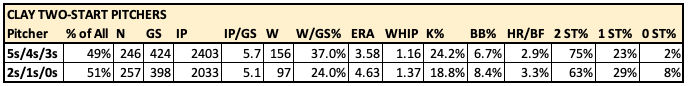
A third way to consider the rankings is a binary look that separates the pitchers into two basic groups and simply says, “start the 3s, 4s, and 5s and bench the 0s, 1s, and 2s.” Consider this the quick-and-dirty, thumbs up/thumbs down method.
Todd Zola’s Results
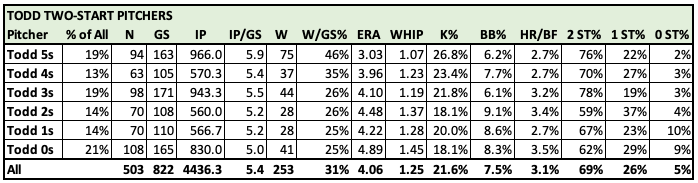
The two statistics that most precisely fell in line with expectations based on Todd’s rankings were innings pitched per games started (IP/GS) and wins per games started (W/GS%). Todd’s 5s shined brightly by averaging 5.9 IP/GS, which helped them win 46 percent of their starts. The pattern generally continued down the line all the way to his 0s, who averaged just 5.0 innings per start and won 25 percent of their efforts. There was a notable separation at the top in wins per start, with the top two tiers winning 46 and 35 percent of their starts, respectively, while the bottom four tiers won just 25-26 percent of their starts.
When it comes to the other categories, the results for these pitchers generally correspond well with Todd’s rankings, with the main exception being his 2s and 1s. In the first half, his 1s outperformed his 2s in ERA, WHIP, strikeout rate, home run rate, and percentage of weeks with two starts. There was a slight anomaly in WHIP for Todd’s 4s (1.23 WHIP) versus Todd’s 3s (1.19 WHIP), but the 4s were better in W/GS, ERA, and strikeout rate, which made them a better choice to start all things considered.
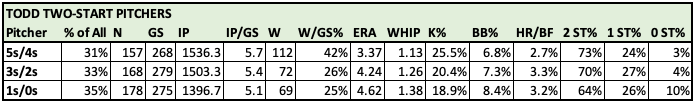
Just as above with Clay’s pitchers, we can compress Todd’s pitchers from six different rankings down to three by combining the groups. This produces a more distinct tiering, with his 4s and 5s being good options, his 0s and 1s being high-risk, and his 2s and 3s being on the fence.
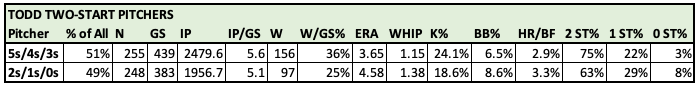
Finally, the binary, take it or leave it, simple yes or no option for those who don’t want to think too much.
The Change In Offensive Environment In May
In addition to the usual difficulties predicting how a pitcher will perform over a seven-day period, this year we saw an added twist—a dramatic shift in home run rate in May, which led to more home runs allowed and an increase in ERA and WHIP for pitchers. The first two-start week for the podcast was the week beginning April 11. The fourth two-start week ended on May 8. When we look at the four weeks from April 11 to May 8 compared to the 10 weeks from May 9 to the All-Star break, we see how the change in offense affected the two-start pitchers.
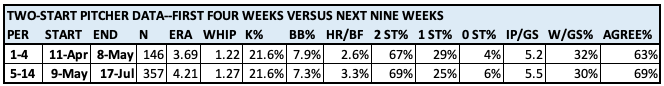
During the first four weeks that Clay and Todd ranked two-start pitchers, the pitchers combined for a 3.69 ERA, 1.22 WHIP, and allowed home runs to 2.6 percent of the batters they faced. Right around May 9, something changed (The baseball? Humidors? Weather?). From that point to the All-Star break, the two-start pitchers combined for a 4.21 ERA, 1.27 WHIP, and allowed home runs to 3.3 percent of the batters they faced. The strikeout rate remained the same and the walk rate went down, but that home run rate increased significantly, which just added another layer of difficulty to predicting what a two-start pitcher will do in a given week.
For historical context, a 2.6 percent HR/BF is similar to the seasons from 2007 to 2015, which was right before the MLB home run rate increased significantly in the middle of the 2016 season. A 3.3 percent HR/BF is the same as 2017 and 2021, which were two of the four highest HR/BF seasons in MLB history (with only 2019 and 2020 being higher).


