Hall of Fame Ballot through Salaries, Superlatives, and Similarity Scores
Most every baseball fan has their own personal take on the Baseball Hall of Fame ballot. They have their own standards, their own numbers to look at, their own feelings about the Hall of Fame candidacy of the eligible players. Some go more by specific statistics than by feel. There are “Big Hall” and “Small Hall” types. Performance-enhancing drugs and off-field transgressions play a role for some but not for others. All in all, it’s a big mishmash of personal perspectives.
For me, it’s more about the modern metrics, like WAR and wRC+, than by pitcher wins or hitter RBI or the nebulous “feels like a Hall of Famer.” Today, though, I’m going down a different path. Forget the actual numbers created by the players on the field. I’m going to look at the 28-man BBWAA Hall of Fame ballot through the lens of salaries, superlatives, and similarity scores.
The salaries come from a few sources, namely Cot’s Baseball Contracts, Spotrac, and each player’s page at Baseball-Reference. I put players into groups based on similar start and end dates for their careers, so we’re not comparing players who primarily played in the late 1990s/early 2000s to players who were active in the 2010s. Salaries have gone up, so I kept players in groups with similar career spans to account for this. This answers the simple question: how much did teams value this player?
The superlatives are the awards won, like All-Star teams made, Rookie of the Year and Cy Young Awards, MVPs, Silver Sluggers, and Gold Gloves. How often was this player recognized for superlative play?
Similarity scores come from each player’s page at Baseball-Reference. They were introduced by Bill James in the mid-1980s and the methodology used at Baseball-Reference was taken from The Politics of Glory (pages 86-106), as explained here. What players were this player most similar to?
Finally, in the Voting section of the graphics for these players, the “%VOTE” is the percentage of the vote each player received last year and “TRCKR” is the player’s current vote percentage based on the Hall of Fame tracker kept by Ryan Thibodaux on Twitter (@NotMrTibbs), which can be found here. The TRCKR total is based on updates through January 15.
Let’s get started with the players who have been on the ballot the longest:
Gary Sheffield, played from 1988 to 2009, 9th year on the ballot
Omar Vizquel, played from 1989 to 2012, 6th year on the ballot
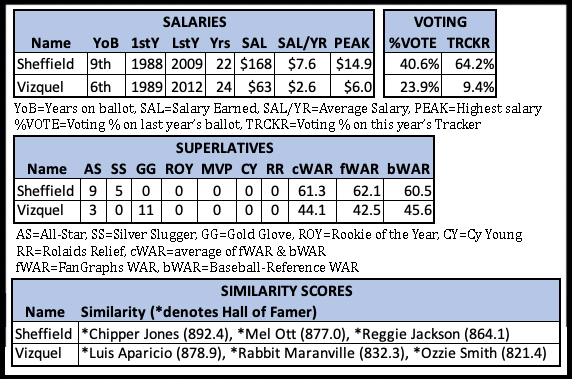
Gary Sheffield and Omar Vizquel are the Odd Couple on this Hall of Fame ballot. They were contemporaries for two decades, but had wildly different skillsets. Sheffield mashed at the plate and was a butcher in the field. Vizquel’s bat was made of balsa wood, but his glove was smooth as silk. Sheffield was named to nine all-star teams and won five Silver Slugger awards, while Vizquel made three all-star teams and won 11 Gold Gloves. Sheffield earned $100 million more over his career than Vizquel earned during his. Both have Hall of Famers as their top three most similar players, but Sheffield’s trio is much more impressive than Vizquel’s.
When it comes to Hall of Fame voting, they’ve also gone in wildly different directions. Consider Sheffield’s’ first eight years on the ballot, during which he stagnated for five years, then made a big jump in year 6 and another solid jump in year 7:
2015—11.7%
2016—11.6%
2017—13.3%
2018—11.1%
2019—13.6%
2020—30.5%
2021—40.6%
2022—40.6%
Compare that to Vizquel’s first five years on the ballot:
2018—37.0%
2019—42.8%
2020—52.6%
2021—49.1%
2022—23.9%
It took Sheffield seven years on the ballot to equal Vizquel’s voting percentage in his first year and Sheffield still hasn’t reached Vizquel’s peak voting percentage of 52.6% in 2020. Sheffield’s case has been tainted by PED allegations, while Vizquel’s recent drop in vote percentage corresponds to allegations of domestic violence and sexual assault. If this were a race to the Hall of Fame, Sheffield would be the tortoise and Vizquel would be the hare, but neither looks on track to cross the finish line in their allotted 10 years.
Alex Rodriguez, played from 1994 to 2016, 2nd year on the ballot
Manny Ramirez, played from 1993 to 2011, 7th year on the ballot
Jeff Kent, played from 1992 to 2008, 10th year on the ballot
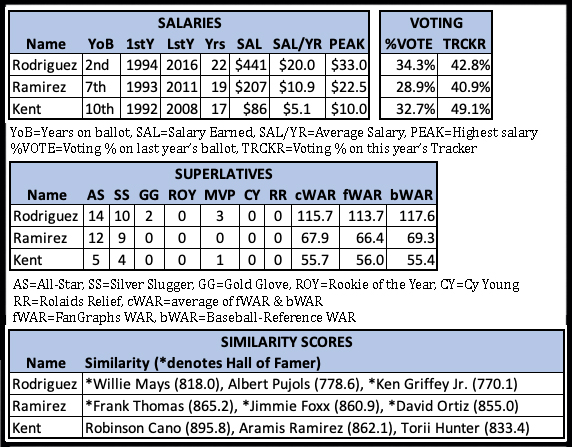
What is there to say about Alex Rodriguez? Without the PED suspension, he’s a slam-dunk, first-ballot Hall of Famer who ranks 17th all-time in FanGraphs War and 16th in Baseball-Reference WAR, among such legends as Lou Gehrig, Mickey Mantle, and Rickey Henderson. Manny Ramirez was one hell of a player in his own right, and A-Rod had almost 50 more WAR than Manny and earned more than double his salary. In fact, you could combine the WAR and salaries of Manny Ramirez and Jeff Kent and still fall short of A-Rod in both categories.
All three of these players were very close in voting percentage last year and are tracking within 10 percentage points of each other this year. Ramirez is unlikely to make the jump he needs with just three years left on the ballot and who knows what might happen with A-Rod over the next eight years as the BBWAA voters change over time. Kent will be done after this year, but he seems like a Fred McGriff-type who could make the Hall of Fame through one of the Era Committees sometime down the road.
Andy Pettitte, played from 1995 to 2013, 5th year on the ballot
Billy Wagner, played from 1995 to 2010, 8th year on the ballot
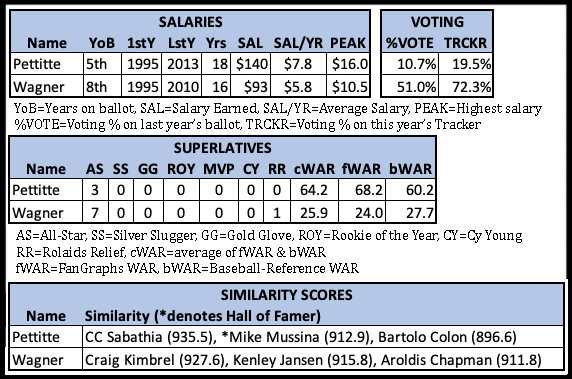
I have a difficult time justifying any non-Mariano Rivera relief pitcher from the last 40 years as being worthy of Hall of Fame status and looking at these two pitchers is a pretty good illustration why. Pettitte pitched 3316 innings to 903 for Wagner. That’s a massive difference and it’s reflected in their respective WARs, with Pettitte being worth roughly 65 WAR and Wagner around 25 WAR. Pettitte also earned $47 million more in his career and was paid 1.6 times as much as Wagner in their peak earning season.
To justify Wagner as a Hall of Famer over Pettitte, you really have to put relief pitchers in their own separate category—not as a pitcher in general, but as a pitcher used in a very specific role. For me, it comes down to this: If I was putting together a team in 1995 and could choose between Pettitte or Wagner knowing that they would have exactly the careers that they had, I would take Pettitte without question. And yet, he’s made almost no progress in Hall of Fame voting in his first four years on the ballot, while Wagner has made significant strides over the last three years, from 16.7% in 2019 all the way up to 51% last year.
Scott Rolen, played from 1996 to 2012, 6th year on the ballot
Andruw Jones, played from 1996 to 2012, 6th year on the ballot
Bobby Abreu, played from 1996 to 2014, 4th year on the ballot
Todd Helton, played from 1997 to 2013, 5th year on the ballot
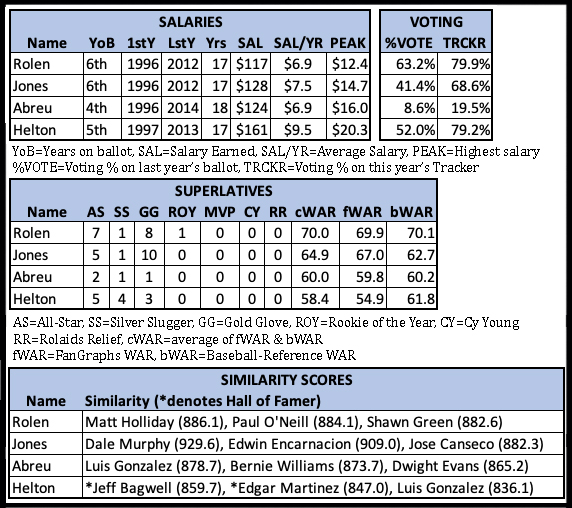
Scott Rolen and Todd Helton are the only players on the ballot who are currently above the 75% needed for enshrinement based on the Baseball Hall of Fame Tracker, but it’s still very much in question whether either will remain there when all the votes are in. Rolen should finish with the highest percentage of any player this year, making him the most likely candidate to join Fred McGriff in Cooperstown in the summer.
Rolen has made big strides since getting just 10.2% of the vote in his first year on the ballot, upping his percentage to 17.2% in year two, 35.3% in year three, 52.9% in year four, and 63.2% in year five. Todd Helton actually started with higher percentage than Rolen in their respective first years on the ballot, but Rolen caught him in year four (Helton: 16.5%, 29.2%, 44.9%, 52.0%). It seems more likely than not that both will make it before their 10 years are up.
Andruw Jones slots in below Rolen and Helton when it comes to his likelihood to make the Hall of Fame through the BBWAA and Bobby Abreu doesn’t have much momentum despite being sandwiched between Hall of Famers Dave Winfield and Vladimir Guerrero in the Jay Jaffe JAWS metric at Baseball-Reference. If WAR does what it purports to do, which I think it does, then Abreu is the most underrated player on the ballot.
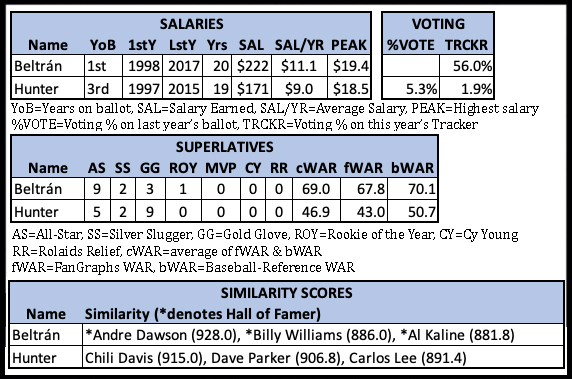
Carlos Beltran, played from 1998 to 2017, 1st year on the ballot
Torii Hunter, played from 1997 to 2015, 3rd year on the ballot
Carlos Beltran and Torii Hunter exemplify the difference between the Hall of Fame and the Hall of Very Good. Beltran earned $50 million more in salary over a comparable career length and time frame, made the All-Star team nine times to Hunter’s five, and is most similar to three Hall of Fame outfielders—Andre Dawson, Billy Williams, and Al Kaline—while Hunter is similar to other very good players, such as Dave Parker. Hunter does have Beltran beat in Gold Gloves and had a Hall of Fame smile, but that doesn’t make up for the difference in hitting. Beltran won’t make it this year, but it looks like he’ll earn a good first-ballot total, while Hunter may drop off the ballot altogether.
Mark Buehrle, played from 2000 to 2015, 3rd year on the ballot
John Lackey, played from 2002 to 2017, 1st year on the ballot
Bronson Arroyo, played from 2000 to 2017, 1st year on the ballot
R.A. Dickey, played from 2001 to 2017, 1st year on the ballot
Francisco Rodriguez, played from 2002 to 2017, 1st year on the ballot
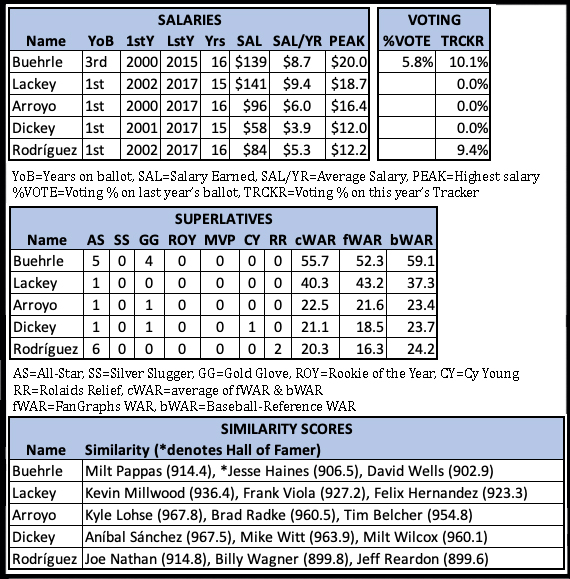
Mark Buehrle and John Lackey earned about the same amount in salary over their careers, but Buehrle has a significant advantage in WAR and All-Star teams made, along with his four Gold Gloves. This has allowed Buehrle to earn enough votes to remain on the ballot for a third year while Lackey looks like a one-and-done guy.
Buehrle has Hall of Fame pitcher Jesse Haines among his most similar pitchers. Haines was 210-158, with a 3.64 ERA (109 ERA+) while pitching primarily for the St. Louis Cardinals from 1918 to 1937. He was on 12 BBWAA ballots and never received more than 8.3% of the vote, then was inducted by the Veteran’s Committee in 1970. I could see a similar path for Buehrle, who was 214-160 with a 3.81 ERA (117 ERA+). The evolution of starting pitcher usage over the last 20 years that has resulted in lower career innings pitched and win totals will need to be accounted for by Hall of Fame voters in order to prevent pitchers from this era of baseball from being woefully under-represented in Cooperstown.
Neither Bronson Arroyo nor R.A. Dickey were as good for as long as Buehrle and Lackey, but each made an All-Star team and Dickey won the NL Cy Young Award at the age of 37 in 2012 with his fabulous fluttering knuckleball, which is awesome. They were both worth about as much as Francisco Rodriguez in WAR, but neither have a vote on the Hall of Fame Tracker, while K-Rod is around 9%.
Jimmy Rollins, played from 2000 to 2016, 2nd year on the ballot
Jayson Werth, played from 2002 to 2017, 1st year on the ballot
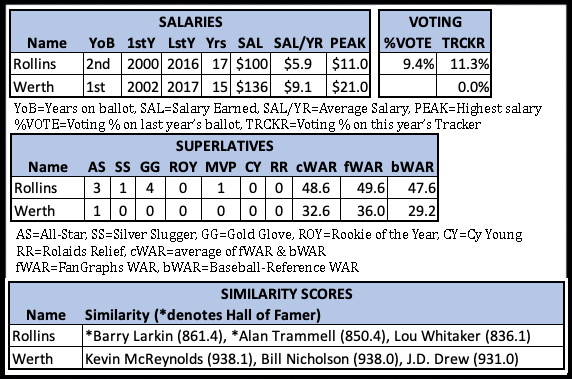
Jimmy Rollins and Jayson Werth played together on the Philadelphia Phillies from 2007-2010, which was a very successful time for the franchise as they made the playoffs all four years and won the World Series in 2008. During those for years as teammates, Rollins won the NL MVP Award in 2007 and was worth 16.3 fWAR and 15.3 bWAR. Werth didn’t win any MVP Awards, but was actually the more valuable player, with 18.0 fWAR and 15.7 bWAR.
Overall, though, Rollins was a more valuable player than Werth, despite earning $36 million less and never coming particularly close to Werth’s peak earnings of $21 million in a season. Rollins had 9.4% of the vote in his first year on the ballot and is currently right around that mark in his second year. He has Hall of Famers Barry Larkin and Alan Trammell as his top two most similar players and the third player on the list, Lou Whitaker, belongs in the Hall of Fame in the opinion of your humble author. I don’t see Rollins as being at that level, but I believe he was better than Omar Vizquel, who had a much higher voting percentage in his first year on the ballot.
Werth hasn’t received a vote this year and probably won’t going forward, which is reasonable. It took him a long time to get established in the big leagues, but from 2008 to 2014, ages 29-35, he was 12th in the National League in FanGraphs WAR (28.1 or 4 WAR/year).
Jacoby Ellsbury, played from 2007 to 2017, 1st year on the ballot
Jhonny Peralta, played from 2003 to 2017, 1st year on the ballot
J.J. Hardy, played from 2005 to 2017, 1st year on the ballot
Mike Napoli, played from 2006 to 2017, 1st year on the ballot
Andre Ethier, played from 2006 to 2017, 1st year on the ballot
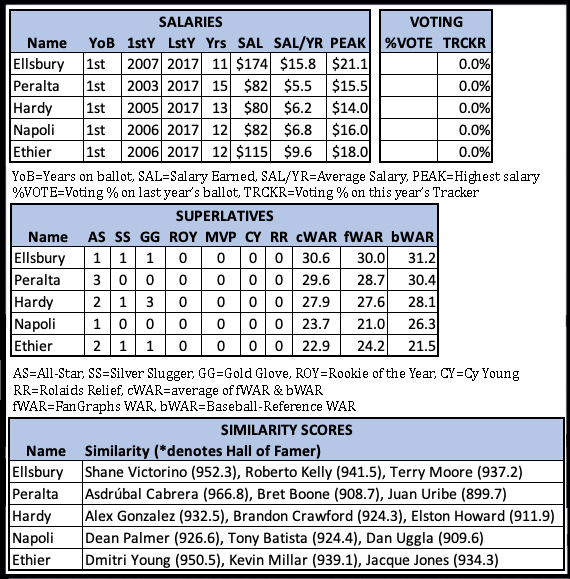
This penultimate group consists entirely of 1st-ballot position players, none of whom are likely to remain on the ballot for a second year. Jacoby Ellsbury and Andre Ethier rank #1 and #2 in salary earned, but #1 and #5 in combined WAR (average of FanGraphs and Baseball-Reference). Ellsbury famously signed a 7-year, $153-million contract with the New York Yankees that resulted in one above-average year, three below-to-average years, and three years of getting paid for nothing when injuries took their toll and his career ended after his age-33 season. Ethier was a reliable outfielder for the Dodgers who was a 2-3 WAR player during his peak.
Jhonny Peralta and J.J. Hardy were contemporaries who had similar career totals in WAR, earnings, and All-Star teams made. Peralta was a slightly above-average hitter (103 wRC+) with a fine glove, while Hardy was a below-average hitter (89 wRC+) with a great glove. For fans who vividly remember MLB in the late 1990s/early 2000s, the Alex Gonzalez who is the most similar player to J.J. Hardy is the Alex Gonzalez who played for the Marlins, Reds, Atlanta, Brewers, Tigers, and Royals from 1998 to 2014 and NOT the Alex Gonzalez who played for the Blue Jays, Cubs, Rays, Padres, Expos, and Phillies from 1994 to 2006. That was a confusing time for baseball fans, what with the multiple Alex Gonzalezes and Bobby Joneses.
As for Mike Napoli, what more is there to say than, “Party at Napoli’s!”
Jered Weaver, played from 2006 to 2017, 1st year on the ballot
Matt Cain, played from 2005 to 2017, 1st year on the ballot
Huston Street, played from 2005 to 2017, 1st year on the ballot
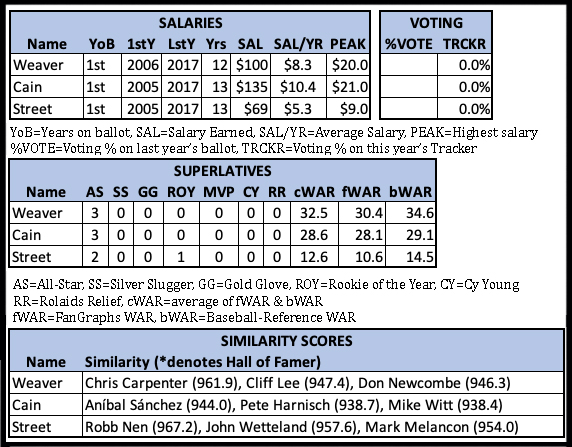
This final group consists of pitchers in their first year on the ballot, none of whom will make it to a second ballot. Still, making the Hall of Fame ballot is impressive in its own right, so kudos to them. Jered Weaver was good enough to make three All-Star teams and finish in the top five in AL Cy Young voting three straight years from 2010-2012. He also ranked 10th among pitchers in FanGraphs WAR during the first eight years of his career (averaging 3.6 fWAR/year).
Matt Cain also made three All-Star teams while earning $35 million more than Weaver. He was famous in the fantasy baseball world for consistently outpitching his FIP during the four-year stretch from 2009 to 2012, when he had a 2.93 ERA, 3.46 FIP, and 3.94 xFIP. Whether it was luck or ability or some combination of both, it didn’t last his entire career. From 2013 to 2017, he had a 4.82 ERA, 4.67 FIP, and 4.49 xFIP. Cain also earned World Series rings with the San Francisco Giants in 2010, 2012, and 2014.
Huston Street earned a little more than half of what Matt Cain earned in the same number of big-league seasons, and 69% of what Jered Weaver earned despite pitching one more year than Weaver. He also has less than half the WAR of either starter. He won the AL Rookie of the Year Award in 2005 despite not necessarily being any better than Joe Blanton or Scott Kazmir, who finished sixth and ninth in the voting. He ranks 20th all-time in saves, right between Jose Mesa and Roberto Hernandez.


