Choose Your Bearded Pitcher: Lucas Giolito or Lance Lynn?
With the trade deadline looming, a pair of Chicago White Sox bearded starting pitchers were shipped off to California recently. Lucas Giolito was traded to the Los Angeles Angels and Lance Lynn was traded to the Los Angeles Dodgers. Through July 30, Giolito clearly appeared to be the better pitcher, with a 3.85 ERA that is significantly lower than Lance Lynn’s 6.47 ERA.
This got me thinking of the following poll question: What is the most likely outcome for Lucas Gilioto and Lance Lynn from this point forward?
- Lynn’s ERA will be more than 1.25 higher than Giolito’s
- Lynn’s ERA will be between 0.75 and 1.24 higher than Giolito’s
- Lynn’s ERA will be between 0.26 and 0.74 higher than Giolito’s
- Lynn’s ERA will be within 0.25 of Giolito’s in either direction
- Lynn’s ERA will be between 0.26 and 0.74 lower than Giolito’s
- Lynn’s ERA will be between 0.75 and 1.24 lower than Giolito’s
- Lynn’s ERA will be more than 1.25 lower than Giolito’s
If you believe each pitcher will continue to pitch like they have so far, you would choose #1 because Lynn’s current ERA is 2.62 higher than Giolito’s. It’s not even close.
Disregarding ERA
Let’s look at some other numbers. The chart below show’s each pitcher’s ERA and their “ERA estimators,” which can be found at FanGraphs. Paraphrased from the FanGraphs glossary:
- xERAuses exit velocity, launch angle, and sprint speed on “topped” or “weakly hit” balls to model what a player’s ERA would look like based on the underlying characteristics of the balls in play.
- FIP is a statistic that estimates a pitcher’s run prevention independent of their defense. It uses strikeouts, walks, and home runs allowed, which are the three things a pitcher has the most control over.
- xFIP is similar to FIP in that it also uses a pitcher’s strikeouts and walks. The difference is that xFIP replaces a pitcher’s actual home runs allowed with a league average rate of home run to fly ball percentage.
- SIERA does not ignore balls in play like FIP and xFIP do, which means it “adds in complexity in an attempt to more accurately model what makes a pitcher successful.”
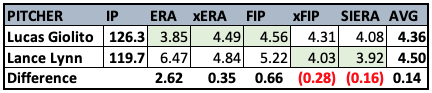
There’s more than a two-and-a-half run difference between Giolito’s ERA and Lynn’s ERA, but the other metrics tell a different story. Giolito still has the advantage in xERA and FIP, but the edge is not nearly as big as he has in ERA. Lynn, on the other hand, has a lower xFIP and SIERA than Giolito. When the ERA estimators are averaged together, Giolito’s edge drops to 0.14. Over 120 innings, that’s a difference of about two runs allowed.
Why are these metrics important? They’re important because MLB teams aren’t concerned so much with ERA these days. They know how misleading it can be. MLB.com’s Mike Petriello tweeted about this recently, pointing out the ERAs of pitchers who had been traded up to that point. Some of those pitchers are listed below:
- Shintaro Fujinami à Orioles (8.57 ERA)
- Lance Lynn à Dodgers (6.47 ERA)
- Pierce Johnson à Atlanta (6.00 ERA)
- Joe Kelly à Dodgers (4.97 ERA)
- Dylan Floro à Twins (4.54 ERA)
- Reynaldo Lopez à Dodgers (4.29 ERA)
Look at the teams acquiring these pitchers—the Orioles, Dodgers, Atlanta, and Minnesota. These are smart teams who know what they’re doing. The Dodgers, in particular, have been very successful over the last decade. They know Lance Lynn isn’t really a 6.47 ERA pitcher. Behind the scenes, MLB teams likely have their own version of xERA, FIP, or SIERA that they’ve created and trust more than ERA to predict rest-of-season performance.
Other Metrics to Consider
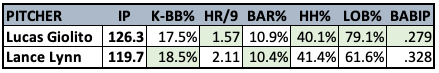
MLB teams also look at other metrics, like the ones shown in the chart above. Many knowledgeable baseball analysts focus in on a pitcher’s K-BB% as possibly the single most important thing to know about a pitcher because strikeouts and walks are the two things a pitcher has the most control over. That’s not to say they have no control over balls in play, just that they don’t have as much control as many people might think. Strikeouts and walks are key, which makes K-BB% so informative. In the case of Giolito and Lynn, Lynn actually has a better K-BB%.
Lynn’s biggest problems with run prevention have been home runs allowed per nine innings (HR/9), Left On Base percentage (LOB%), and Batting Average on Balls In Play (BABIP), all of which are displayed in the chart above. Lynn’s 2.11 HR/9 is the worst of his career, as is his 61.6% LOB%. The last time he allowed a BABIP higher than .328 was in 2018. These numbers are likely to regress to his career norms over the next two months.
The BABIP comparison is particularly notable for pitchers who have played on the same team all season, with presumably a similar defense behind them. Lynn’s BABIP is 0.49 higher than Giolito’s. Funny thing, last year Giolito allowed a .340 BABIP and Lynn’s BABIP was .294. This year, it’s Giolito with the sub-.300 BABIP, at .279, while Lynn has gone the opposite direction, with his increase to a .328 BABIP. Even without taking into account the new defenses that will affect their BABIP allowed after their trades, Giolito’s BABIP is likely to increase closer to the league average of .294, while Lynn’s is likely to decrease.
The other two metrics shown above are Barrel percentage (BAR%) and Hard-Hit percentage (HH%). Lynn has allowed a slightly lower percentage of barrels, which are balls hit at the optimal exit velocity and launch angle. Giolito has a slightly lower HH%. They’re close enough to not worry about the slight difference between them.
What About Their Stuff?
Another way to analyze a pitcher is to disregard the outcome of their pitches and focus on the quality of their pitches. Two metrics that attempt to do this are Stuff+ and PitchingBot, which were introduced at FanGraphs in March.
From the link above:
PitchingBot takes inputs such as pitcher handedness, batter handedness, strike zone height, count, velocity, spin rate, movement, release point, extension, and location to determine the quality of a pitch, as well as its possible outcomes. Those outcomes are then aggregated and normalized on a 20-80 scouting scale, which is what is displayed on the leaderboards.
Stuff+ only looks at the physical characteristics of a pitch, including but not limited to: release point, velocity, vertical and horizontal movement, and spin rate. Generally, the model aims to capture the “nastiest” pitches in baseball. Location+ is a count- and pitch type-adjusted judge of a pitcher’s ability to put pitches in the right place. It ignores a pitch’s physical characteristics and looks at count, pitch type and location. The overall model, Pitching+, is not just a weighted average of Stuff+ and Location+ across a pitcher’s arsenal. Rather, it is a third model that uses the physical characteristics, location, and count of each pitch to try to judge the overall quality of the pitcher’s process. Batter handedness is also included in Pitching+, capturing platoon splits on pitch movements and locations.
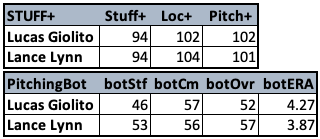
The two pitchers have very similar Stuff+ numbers. They’re close enough that they can be considered equals. Lynn’s pitches look better based on PitchingBot, with a botERA that’s 0.40 lower than Giolito.
What Do the Projections Say?
The last thing we’ll look at is the projections. The projections displayed below are ZiPS, Steamer, THE BAT, and ATC. The first three—ZiPS, Steamer, and THE BAT—are the work of Dan Szymborski, Jared Cross, and Derek Carty, while ATC is a combination of projections pulled together by Ariel Cohen.
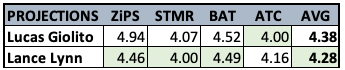
When it comes to the future, ZiPS, Steamer, and THE BAT favor Lance Lynn, while ATC prefers Lucas Giolito. Averaging the four together results in a 4.28 ERA for Lynn and a 4.38 ERA for Giolito. That’s a negligible difference in ERA over their projected 65-ish innings for the rest of the season. It comes out to just a run or two.
If I were to answer my own poll question from above, I would choose the middle answer: Lynn’s ERA will be within 0.25 of Giolito’s in either direction. I don’t know who will be better, but I expect the difference will be small; definitely not anywhere close to the more than two-and-a-half run difference there is today.
The Dodgers and Angels should both be happy with their new rotation members at the end of the season.


