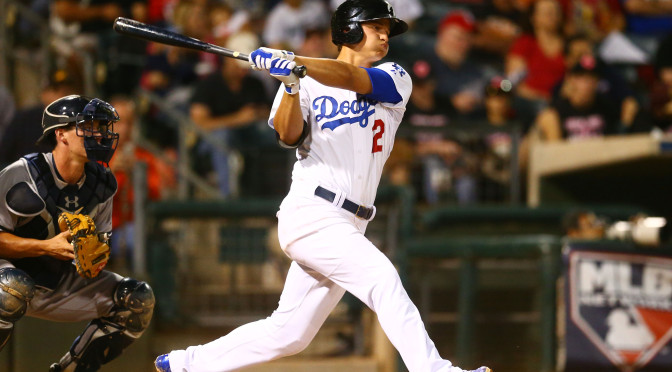
At just 22 years young, Corey Seager of the Los Angeles Dodgers has, somewhat quietly, been the best shortstop in the National League in 2016. Sure, Trevor Story of the Rockies is beating Seager in homeruns (17 to 15) and received most of the early season hype. Similarly, Aledmys Diaz of the Cardinals is 35 points ahead of Seager in batting average, .315 to .280. Then there is Brandon Crawford, who may be the best defensive shortstop in the NL now that Andrelton Simmons is in the AL. Looking at the sum of the parts, however, Corey Seager would be my choice to start in this years’ All-Star game even as a rookie on the senior circuit.
Seager was not in the NL lead for shortstops in the June 8th All-Star Game voting update. In fact, the 2015 top prospect was not even in the top five, despite leading the NL in fWAR for shortstops at 2.8. The names ahead of him include the aforementioned Crawford (2.7 WAR) and Story (1.5), as well as Addison Russell (1.1), Asdrubal Cabrera (0.7), and Zack Cozart (1.6). But, while Seager may not get an all-star nod this season, there is reason to believe that he will be in the running for several years to come.
First, I would like to take a look at what Seager has done so far in his short major league career, to determine whether or not his numbers fall in line with his minor league track record. As of June 15th, Seager had accumulated a batting line of .295/.365/.526 throughout his first 92 career, good for an .891 OPS. Taking his counting stats over those same 92 games and stretching them into a full 162-game season, Seager would accumulate an average of 35 doubles, 33 homeruns, 93 RBIs and 104 runs scored to go along with a 16.8% strikeout rate and a very good 9.6% walk rate. Make no mistake, those are great numbers, especially for a shortstop, and it is easy to think that Seager will soon return to earth.
Now take into account his minor league track record. In 390 minor league games, Corey Seager put up an almost identical batting line of .307/.368/.523, which also adds to an .891 OPS. Seager’s 162-game averages in the minors are 48 doubles, 26 homeruns, 115 RBIs and 108 runs scored. These numbers, again, came with a 18.4% SO rate and an 8.5% walk rate. Generally speaking, all of Seager’s MLB production so far has fallen almost perfectly in line with his production in the minors. The doubles and homerun totals are probably the biggest difference, but it is reasonable that at the age of 22, Seager is now turning his doubles power into homerun power.
That being said, young hitters entering the majors will typically run into a period of adjustment. This usually happens after they have been in the big leagues long enough for pitchers to begin recognizing trends and compiling scouting reports on them. Sean Morash covered a similar theme for young pitchers regression last fall. On the surface, Seager hasn’t seemed to face any such adjustment period; however, I think that adjustment period may have already come and gone. I will explain using the three graphs below:
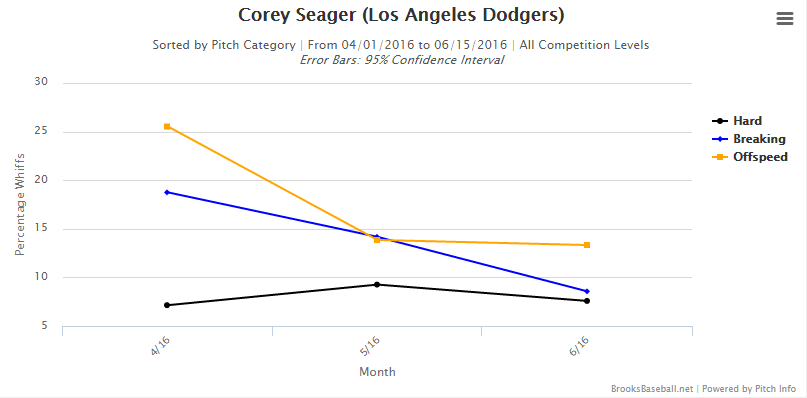
This first graph shows the percentage of swings and misses by Seager from month to month in 2016, broken down by pitch type. As you can see, April saw Seager swing and miss a good amount on breaking pitches, and a whole lot more on offspeed pitches. As a result, pitchers began throwing more offspeed and breaking stuff to him, jumping from 36.18% in April to 41.47% by May. But Seager adjusted rather quickly, decreasing his whiff rates on those pitches dramatically from April to now. As a result, the number of breaking and offspeed pitches seen by Seager has dropped back down to 31.80% in June. Now look at the next two graphs to see just how significant these improvements have been:
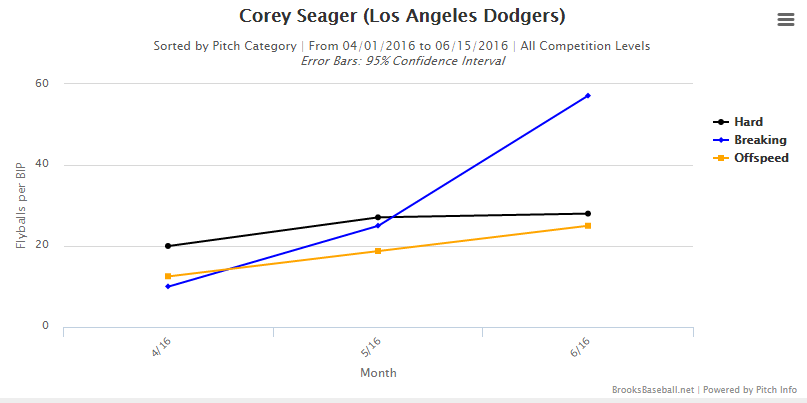
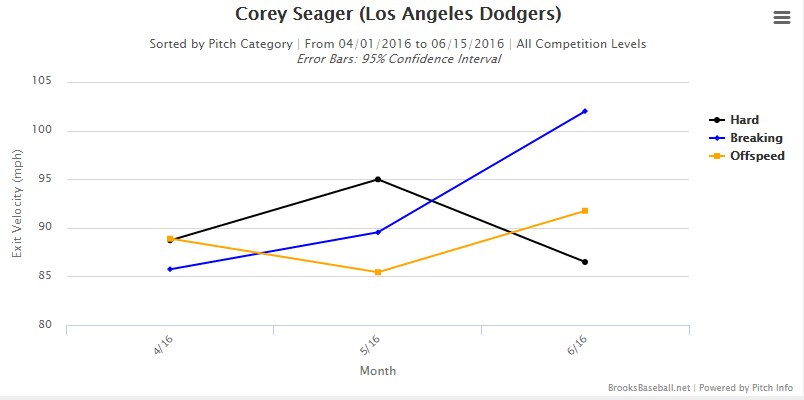
These graphs show Corey Seager’s month to month batted ball exit velocities as well as his percentage of fly balls per ball put in play, again broken down by pitch type. Ignoring fastballs, Seager has greatly increased the exit velocity on breaking pitches and offspeed pitches each month this season. Simultaneously, he has been putting far more balls in the air than he was in April, specifically on breaking balls.
So now, we know that Corey Seager has been swinging and missing less and less each month, while also hitting more balls in the air and with more authority. What does this mean? This means that Seager is tapping into his extra base power, aka more doubles, triples, and homeruns. This is further supported by the fact that Seager only has one infield fly on the season. When he puts the ball in the air, it tends to travel.
So in theory, Seager should be producing more extra base hits. This final graph below makes that theory seem like an understatement:
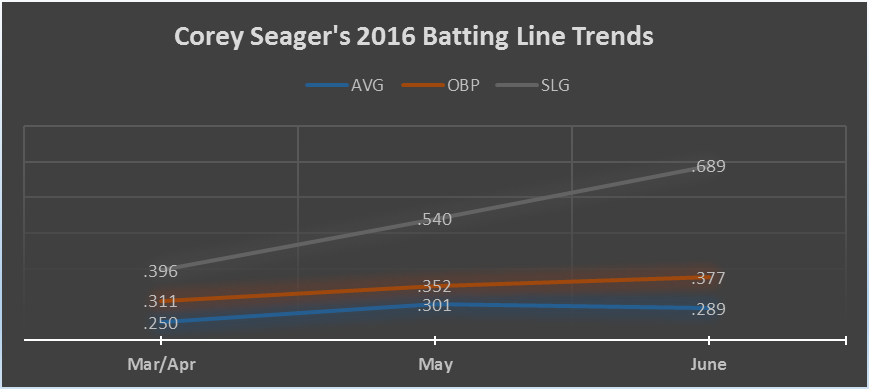
The gray line in the image is slugging percentage. While there have been marginal improvements in Seager’s OBP in 2016, there have been tremendous gains in his SLG%. This is no surprise, as Seager always carried considerable power throughout his prospect days.
If he can continue to make adjustments as needed, then Corey Seager can, and will, become a perennial all-star candidate. It may not come this season, but it will come. The Dodgers have a very valuable player on their hands, one who could consistently hit .285 with 20+ HR and 90 RBIs at the shortstop position. That type of player is incredibly hard to come by.
-Alexander Vacca
References:
Stats courtesy of http://www.fangraphs.com/
Graphs courtesy of http://www.brooksbaseball.net/
Photo courtesy of trueblueLA.