Behind David Price’s Wicked Second Half
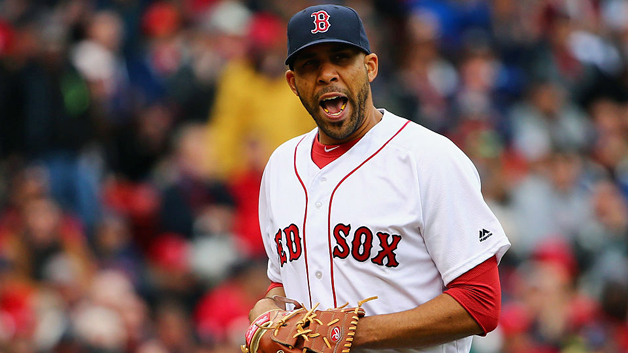
David Price has received an abundance of criticism since donning a Boston Red Sox jersey. Many critics claim that up to this point, Price hasn’t earned the seven-year, $217 million contract he signed before the 2016 season. He’s put up respectable numbers: a 3.99 ERA in 2016, 3.38 ERA in 2017, and a 3.42 ERA so far this year, but he hasn’t lived up to the ace-caliber reputation he constructed for himself after dominant years with the Rays and Blue Jays.
David Price was a workhorse in 2016, leading the league by throwing 230 innings. However, in 2017, injuries limited him to just 74.2 innings. This year he’s on track to finish around 180 frames, in a year where he’s seen his velocity dip to the lowest average of his career. His fastball has dropped a full mile per hour from 2017 to 2018, and the 93 MPH number is a far cry from his 2012 days where he was averaging 96.6 MPH. As you can also see from the graph below, the grey reference line indicates leaguewide average fastball velocity. For the first time in his career, Price is below that line.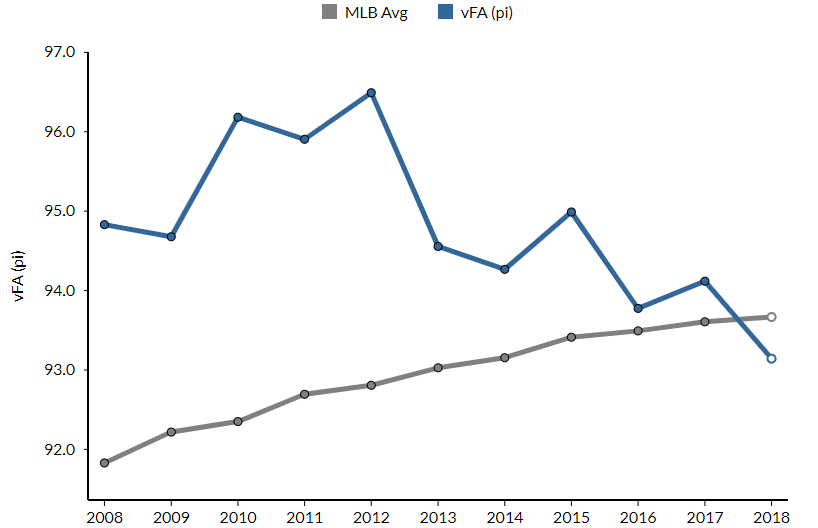
Obviously, velocity has been on the rise in recent years. Additionally, the decline Price is experiencing is expected for an aging pitcher, so this news shouldn’t be too alarming.
We’ve seen pitchers respond to this change in their game. Clayton Kershaw has experienced an even more drastic fastball velocity drop, from 93.1 MPH to 91.5 just in the past year, but he is still posting ace-like numbers, proving that slowing down doesn’t mean you have to sacrifice quality pitching. Previously, we highlighted how Kevin Gausman has made velocity-related adjustments during his time in Atlanta.
In 19 starts prior to the All-Star game, the velocity decrease appeared to weigh on Price’s performance. He posted a 4.42 ERA and a 1.25 WHIP. Many accredited his perceived inability to make adjustments to respond to this change in speed. His lowest point came against the Yankees on June 1, in front of a national audience on Sunday Night Baseball. Price was hammered for eight runs, including five (FIVE!) homeruns. He failed to make it out of the fourth, and the loss allowed the Yankees to move two games back of the Red Sox for first place in the AL East.
After that horrendous start, Price allowed seven runs in 11.1 combined innings across two outings against the lowly Royals and Blue Jays. Price had to adjust, and since those outings , he has.
In nine starts since that horrendous three game stretch, David Price owns a 2.06 ERA, including a 1.56 post-all-star ERA.
In the nine starts from June 20 to September 12, David Price has been getting significant horizontal movement on his fastball (represented by the FA-X in the below). His average fastball horizontal movement in his terrible starts against New York, Kansas City, and Toronto all registered under 5 inches. His first start following those three games didn’t improve much in this department, but in every game since his fastball has been moving over five inches.
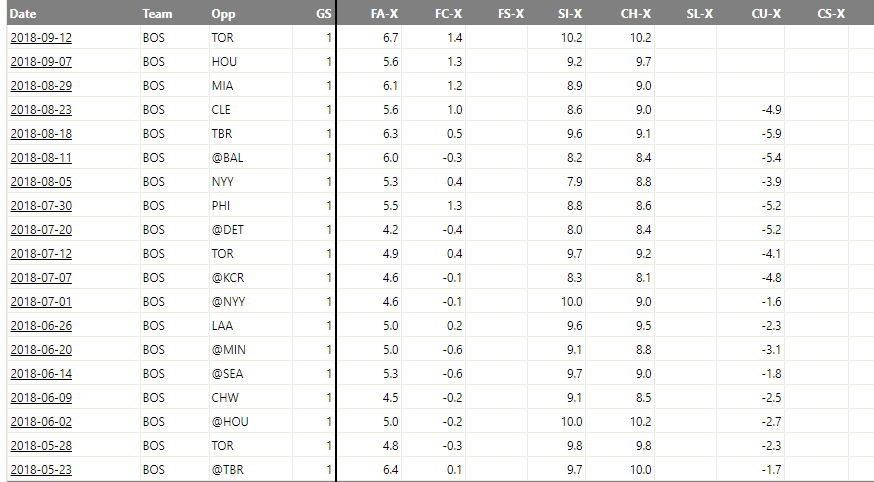
While his slider (SI-X) is demonstrating the same movement it has all year, his curveball (CU-X) is showing a significant increase during his hot stretch, as the chart indicates having horizontal curveball movement 4 inches or more has benefitted the southpaw’s game. Price hasn’t relied too heavily on his curveball this year, but the huge leap in horizontal movement shows the work Price is putting in to counteract his drop in fastball velocity.
This kind of success with his fastball can even be found earlier this year. As seen above, David Price hit five inches of movement on his fastball in starts against Tampa Bay, Houston, Seattle, Minnesota, and Los Angeles. In those five first-half starts, these are Prices numbers:
|
Opponent |
Innings Pitched | Earned Runs Allowed | Homeruns Allowed |
|
Tampa Bay |
6 |
1 |
0 |
|
Houston |
6 |
3 |
0 |
|
Seattle |
7 |
1 |
0 |
|
Minnesota |
7 |
3 |
2 |
| Los Angeles | 6 | 1 |
1 |
The positive values indicate that his fastball has running movement to it: tailing away from right-handed hitters and running towards lefties.
The negative numbers for his curveball show the opposite. This allows Price to dominate both sides of the plate against righties and lefties, and such a drastic change of movement in both directions ensures a softer contact rate. In his last nine starts, Price has an average medium contact rate of 52.86%, with a hard hit rate average of 29.58%. His hard-hit rate percentage ranks 13th among all starters in the second half. Price made the adjustments, and the numbers prove his success.
Price’s hot streak couldn’t have come at a better time for Boston. Chris Sale has been limited in the second half due to injuries, and could even be questionable for the postseason. The Sox need an ace, and Price can be that guy. Even more than that, perhaps he’s discovered something that can help him find success in the second half of his career.


