Overreacting to 2020— Outfield Strategy in Fantasy Baseball
Baseball fans know that last season was the most unusual season of our lifetimes due to a global pandemic. There was the initial spring training, followed by a long layoff, then a second spring training. The season was shortened to 60 games, with teams only playing teams in the same region of the country. Rosters were expanded, double-headers featured seven inning games, there was a universal DH, and extra-innings started with a runner on second. Two teams, the Marlins and Cardinals, had significant off time because of Covid breakouts, which also affected the schedules of numerous other teams.
With that in mind, the consensus during the offseason has been that we should not put too much emphasis on a 60-game season played during a pandemic. Players who outperformed expectations did so in a two-month season, which led to three qualifying pitchers with ERAs under 2.00 (Shane Bieber, Trevor Bauer, Dallas Keuchel). That last time that happened was 1972. On the other hand, some very good hitters performed well below expectations over the two-month season, including Nolan Arenado, J.D. Martinez, and Jose Altuve.
The thing is, we’re human. As much as we tell ourselves not to overreact to the results of a two-month season, we can’t seem to help it. We have more vivid memories of the 2020 season than 2019 and recency bias creeps in. Rookies who debuted and performed well above expectations are like the shiny new toy that we get on our birthday.
One way this manifests itself is in the fantasy baseball world, where players coming off terrific seasons are likely being drafted higher than they should be and players who slumped in 2020 are dropping too far on draft boards. To analyze this, we can compare a player’s average draft position (ADP) in 2021 to their ADP in previous years to determine who has risen up the ranks and who has fallen out of favor based in large part on last year’s shortened schedule.
I compiled ADP data from the National Fantasy Baseball Championships website based on drafts from March 1 through March 14. I then compared this year’s ADP to previous years and sorted by position to get an idea of how fantasy baseball owners are valuing players.
Note #1: I refer to Weighted On-Base Average (wOBA) below. It is a rate statistic that credits a hitter for the value of each outcome rather than treat all hits or times on base equally. It is on the same scale as On-Base Percentage (OBP) and is a better representation of offensive value than batting average, RBI, or OPS. I realize wOBA is not usually a fantasy baseball stat, but in general the top hitters in wOBA will be the top hitters in fantasy baseball, with the caveat that there are plenty of bad hitters who primarily provide value in fantasy baseball through stealing bases.
wOBA Scale:
- Excelent – .400
- Great–.370
- Above Average–.340
- Average–.320
- Below Average–.310
- Poor–.300
- Awful–.290 or below
Note #2: I reference ATC projections below. These are composite projections created by Ariel T. Cohen using a “wisdom of the crowds” approach and are available at FanGraphs.
HELIUM GUYS
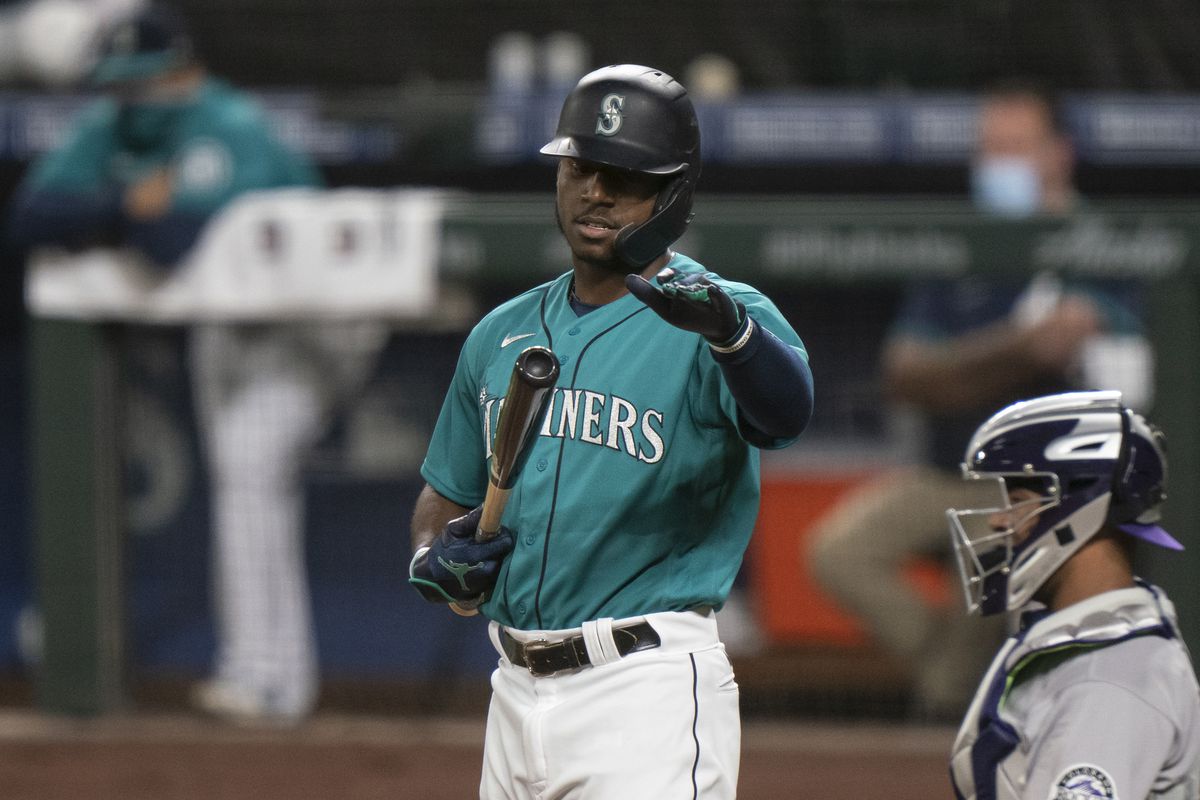
Kyle Lewis, Seattle Mariners
2019 ADP: 749 (75 PA, .357 wOBA)
2020 ADP: 432 (242 PA, .349 wOBA)
2021 ADP: 145
ADP movement: up 287 spots
2021 ATC projection: 610 PA, 76 R, 23 HR, 73 RBI, 8 SB, .242/.322/.416, .320 wOBA
Lewis was the first-round pick of the Seattle Mariners in 2016. He had a good start to his professional career with the Everett Aquasox after signing, right up until a gruesome knee injury ended his season. He was still a top-100 prospect on the Baseball America list prior to the 2017 and 2018 seasons, but after middling production he fell off their list prior to the 2019 season. He played most of 2019 with the Double-A Arkansas Travelers, hitting an uninspiring .263/.342/.398, which wasn’t far off his career numbers in the minor leagues (.260/.334/.417).
The Mariners promoted Lewis to the big leagues in September of 2019 and the outfielder’s career got off to a banging start. He hit homers in his first three major league games and had six dingers in his first 10 games. He finished the year with a .268/.293/.592 batting line that included a .351 BABIP and nearly 39 percent strikeout rate. The power was good, but the plate discipline was bad, and it was hard to know what to expect from Lewis in 2020.
As he had in 2019, Lewis came out strong in 2020, hitting homers in his first two games. He continued to rake over the next month. Through August 25, he had 7 homers in 30 games and was hitting .360/.446/.568 (with a .440 BABIP). His walk rate was way up from 2019, to nearly 14 percent, and his strikeout rate was down, to 23 percent. Everything was coming up roses for Lewis in the Emerald City.
And then it wasn’t. Over his next 28 games, Lewis hit .147/.268/.284 (.196 BABIP) and struck out 37 percent of the time. The one bright spot during this stretch was that he kept his walk rate up around 14 percent. Lewis had a similar hot/cold year to fellow rookie Luis Robert, but Lewis finished with better overall numbers and won the AL Rookie of the Year Award, with Robert finishing second.
Lewis wasn’t on the fantasy radar prior to last year, so his surge up the ADP rankings isn’t surprising. Still, he did really struggle in the second half of 2020 and still has a better ADP than more established players, including Joey Gallo, Tommy Pham, and Michael Brantley. I like Lewis for his upside, but with only 317 career plate appearances and a 31.5 percent strikeout rate, I don’t like him at his current ADP.
Teoscar Hernández, Toronto Blue Jays
2018 ADP: 534 (523 PA, .328 wOBA)
2019 ADP: 382 (464 PA, .325 wOBA)
2020 ADP: 333 (207 PA, .384 wOBA)
2021 ADP: 81
ADP movement: up 252 spots
2021 ATC projection: 567 PA, 77 R, 31 HR, 82 RBI, 11 SB, .245/.311/.483, .336 wOBA
Fun with arbitrary endpoints for Teoscar Hernández in his breakout 2020 season:
15 G, 63 PA, .267/.286/.583, .356 wOBA—July 24 to August 12
21 G, 84 PA, .347/.417/.693, .461 wOBA—August 13 to September 3
14 G, 60 PA, .236/.288/.418, .304 wOBA—September 4 to September 26
Admittedly, it’s not really fair to take an already short season and split it up into even shorter sections, but a significant chunk of Hernández’ production came during that middle 21-game stretch of last season. He hit for great power in his first 15 games, but it was tempered by his .286 OBP. Then he didn’t hit for great power or get on base well in his final 14 games.
The Statcast data for Hernández was off the charts, though. He was in the 96th percentile or higher in Exit Velocity, Hard Hit percentage, Barrel percentage, and xwOBA. His 11.1 percent Barrels per Plate Appearances was fifth in baseball among qualifying hitters, right between Eloy Jimenez and Bryce Harper. There was much to like about his season.
Still, an ADP of 80 doesn’t match up with his projection, which incorporates the less accomplished seasons he had before 2020. In 1,194 career plate appearances prior to the 2020 season, Hernández hit .237/.304/.476, for a wOBA OF .328. That’s not much different from his teammate Randal Grichuk (.246/.295/.483, .327 wOBA), who has an ADP of 268 because he’s not expected to get the playing time that Hernández will get.
That’s not to say I think Grichuk is better than Hernández, but Hernández is being drafted 57 spots ahead of Mike Yastrzemski, for example, and Grandson Yaz has been a much better hitter over the last two years than Hernández. There shouldn’t be 3-4 rounds difference between them.
Ian Happ, Chicago Cubs
2017 ADP: 722 (413 PA, .349 wOBA)
2018 ADP: 119 (462 PA, .329 wOBA)
2019 ADP: 349 (156 PA, .368 wOBA)
2020 ADP: 290 (231 PA, .369 wOBA)
2021 ADP: 160
ADP movement: up 130 spots
2021 ATC projection: 573 PA, 77 R, 26 HR, 72 RBI, 6 SB, .245/.342/.463, .342 wOBA
After being taken in the first round of the 2015 draft by the Chicago Cubs, Happ was on the top prospects lists prior to the 2016 and 2017 seasons. He debuted in the big leagues in May of 2017 and hit 24 homers in 115 games for the Cubs. Add in the nine he hit in Triple-A that year and Happ’s 33 homers in 141 games made fantasy players enthusiastic about the young outfielder heading into the 2018 season. His ADP was 119, making him an 8th-round pick in a 15-team league and the 22nd outfielder off the board.
Happ was an above-average hitter in 2018, but without the power he’d shown the year before. He hit 15 homers in 462 plate appearances and slugged just .408. Fantasy fans soured on him the following spring, as his ADP dropped to 349. In 2019, the Cubs put Albert Almora, Jr. in the lineup in center field and sent Happ back to Triple-A to start the year. Happ returned in late July and hit .264/.333/.564 down the stretch, which bumped his ADP up 102 spots going into 2020.
Now Happ has even more helium, moving up another 130 spots in ADP since last spring. He’s expected to play center field and bat leadoff for the Cubs. The projections at FanGraphs have him pegged for 575 to 600 plate appearances. I think 600 plate appearances is about his ceiling because he’s struggled against lefties in his career (.305 wOBA) and could sit at times.
I also question his projections for 6-9 steals. He stole a combined 16 bases in his first two seasons (875 PA), but just three bases over the last two seasons (387 PA) and he was caught three times in four attempts last year. His career success rate on steals is 63 percent, which is not what you want. Also, his sprint speed has dropped from the 91st percentile in his rookie year to 56th percentile in 2020. I believe his move up in ADP is justified, but I wouldn’t want to take him much sooner than this.
Lourdes Gurriel, Jr., Toronto Blue Jays
2018 ADP: 748 (263 PA, .322 wOBA)
2019 ADP: 253 (343 PA, .358 wOBA)
2020 ADP: 151 (224 PA, .372 wOBA)
2021 ADP: 86
ADP movement: up 65 spots
2021 ATC projection: 595 PA, 77 R, 28 HR, 86 RBI, 8 SB, .274/.318/.482, .339 wOBA
This is the second year in a row Gurriel has moved up significantly in ADP. He was off the radar before his rookie season in 2018, then taken with the 253rd pick going into 2019. That season started poorly. Gurriel hit .175/.250/.275 in his first 13 games and the Blue Jays sent him down to Triple-A to get back on track, which he did quite nicely. Overall, he hit .277/.327/.541 in 84 games for Toronto in 2019.
Prior to the 2020 season, Gurriel was the 151st pick in the draft, on average. Then he went out and had his best season yet, hitting .308/.348/.534. He had some good Statcast numbers, namely a 78th percentile Barrell rate and 91st percentile Hard Hit rate, but his xBA was nearly 30 points lower than his actual batting average and his xSLG was 50 points lower than his actual slugging percentage.
This year, Gurriel has moved up 65 spots and is being drafted around the same time as teammate Teoscar Hernández, with Nick Castellanos, Austin Meadows, and Charlie Blackmon in the same area of ADP. I think he fits in well with this group.
ANVIL GUYS
Joey Gallo, Texas Rangers
2017 ADP: 610 (532 PA, .364 wOBA)
2018 ADP: 103 (577 PA, .343 wOBA)
2019 ADP: 97 (297 PA, .401 wOBA)
2020 ADP: 86 (226 PA, .297 wOBA)
2021 ADP: 148
ADP movement: down 62 spots
2021 ATC projection: 597 PA, 83 R, 39 HR, 90 RBI, 5 SB, .214/.333/.495, .351 wOBA
Gallo shot up the ADP charts following his first 40-homer season in 2017, then moved up a little more after his second 40-homer season in 2018. Despite only playing in 70 games in 2019, Gallo hit well enough for fantasy owners to move him up again heading into the 2020 season. Then came last year’s .181/.301/.378 performance and Gallo has been dropped 62 spots.
Despite the ugly batting line, Gallo still crushed the ball like he had in the past, with a 90th percentile Barrel rate and 85th percentile Exit Velocity. He also had the lowest strikeout rate of his career which, admittedly, was still 35 percent.
The other interesting thing about Gallo’s 2020 season is that he wasn’t bad the whole time. He hit .216/.363/.554 in his first 22 games before going into a deep funk over his last 35 games (.160/.259/.269). Because of the shortened schedule, he didn’t have a full season to make up for that awful stretch, so we’re basically looking at 35 games causing a 62-pick drop in ADP.
I say, pump the brakes, fantasy owners! I think this is a big overreaction. Sure, he’s never going to help a fantasy team’s batting average, but Gallo will ding his dongs with regularity and shouldn’t be docked this much for a 35-game stretch in a 60-game season during a once-in-a-century pandemic.
Ramón Laureano, Oakland Athletics
2018 ADP: N/A (176 PA, .357 wOBA)
2019 ADP: 192 (481 PA, .356 wOBA)
2020 ADP: 82 (222 PA, .315 wOBA)
2021 ADP: 143
ADP movement: down 61 spots
2021 ATC projection: 594 PA, 83 R, 22 HR, 71 RBI, 12 SB, .248/.326/.434, .328 wOBA
Laureano had a nice start to his MLB career with a 48-game stretch in 2018 during which he hit .288/.358/.474, with five homers and seven steals. He was an exciting young player who hit well and made highlight-reel plays on defense, like this catch and 321-foot throw to turn a double play that year.
That good 48-game stretch in 2018 made Laureano fantasy-relevant in the spring of 2019. His ADP was 192, right in the mix with Brandon Nimmo, Harrison Bader, and Jesse Winker. He then hit .288/.340/.521, with 24 big flies and 13 steals in 2019, and his ADP shot up to 82 prior to last year. No longer was he hanging with Nimmo, Bader, and Winker. Now he was keeping company on the ADP charts with Luis Robert, Tommy Pham, and Joey Gallo.
In 2020, Laureano was fine during the first few weeks of the season, hitting .254/.402/.448 in his first 20 games. Then he had a 3-for-29 stretch that contributed to a .190/.296/.319 batting line over his final 34 games. Fantasy owners have responded by dropping his ADP 61 spots to 143.
One of the interesting things about Laureno is his consistency with batted ball data. Over his three-year career, he’s had xwOBAs of .346, .335, and .342, which is essentially the same offensive production each year. He’s done it a bit differently at times, though. He had a 9 percent walk rate his first season, which dropped to 6 percent his second season, then rose back up to 11 percent last year. I believe fantasy owners may have been too high on Laureano last year, at ADP 82, but are too pessimistic this year, at ADP 143. I like him in the 130-ish range, with Wil Myers and Alex Verdugo.
Austin Meadows, Tampa Bay Rays
2018 ADP: 652 (191 PA, .332 wOBA)
2019 ADP: 183 (591 PA, .380 wOBA)
2020 ADP: 41 (152 PA, .292 wOBA)
2021 ADP: 85
ADP movement: down 44 spots
2021 ATC projection: 578 PA, 78 R, 25 HR, 76 RBI, 11 SB, .259/.331/.476, .343 wOBA
Meadows was a major helium guy after his terrific 2019 season when he hit .291/.364/.558, with 33 homers and 12 steals. His ADP went from 183 to 41, which meant he was being drafted just ahead of Aaron Judge, George Springer, and Charlie Blackmon last spring. Fans had seen what Meadows could do in 2019 and were hoping for more of the same.
Unfortunately, the 2020 season was rough on Meadows. It started with a positive test for COVID-19 that caused him to miss the first two weeks of the regular season. He played his first game on August 4 and hit well over the next two weeks. Through August 19, he was hitting .269/.350/.558.
Then the bottom fell out and Meadows struggled for a month, hitting .163/.261/.250, with 33 strikeouts in 92 plate appearances. He was 5-for-his-last-39, with 20 strikeouts, when he was removed from Game 1 of a double-header on September 17. The next day, he was put on the Injured List with a Grade 2 left oblique strain. Meadows returned to the Rays lineup in the ALDS, but still wasn’t his old self. He went 7-for-51 with 18 strikeouts and just 2 walks in 16 post-season games.
Considering everything he dealt with in 2020, I’m willing to give Meadows a mulligan. His nearly three-round drop in ADP is too harsh for a still-very-talented 26-year-old.
This Guy or That Guy?
Let’s wrap-up this look at risers and fallers with a good, old-fashioned game of This Guy or That Guy for players with similar ADPs in 2021.
Kyle Lewis—145 ADP in 2021 (432 ADP in 2020)
Ramon Laureano—143 ADP in 2021 (82 ADP in 2020)
Joey Gallo—148 ADP in 2021 (86 ADP in 2020)
610 PA, 76 R, 23 HR, 73 RBI, 8 SB, .242/.322/.416, .320 wOBA—Lewis (ATC projection)
594 PA, 83 R, 22 HR, 71 RBI, 12 SB, .248/.326/.434, .328 wOBA—Laureano (ATC projection)
597 PA, 83 R, 39 HR, 90 RBI, 5 SB, .214/.333/.495, .351wOBA—Gallo (ATC projection)
My take: Lewis has moved up 287 spots since last year, while Laureano has moved down 61 spots and Gallo has dropped 62 spots. Now, all three outfielders have an ADP within five picks of each other. For me, Lewis is still a big risk, so give me Gallo first and Laureano second among this group.
Teoscar Hernández—81 ADP in 2021 (333 ADP in 2020)
Nick Castellanos—81 ADP in 2021 (92 ADP in 2020)
567 PA, 77 R, 31 HR, 82 RBI, 11 SB, .245/.311/.483, .336wOBA—Hernández (ATC projection)
646 PA, 93 R, 30 HR, 89 RBI, 2 SB, .267/.327/.499, .349 wOBA—Castellanos (ATC projection)
My take: Hernández is the shiny new toy thanks to his breakout 2020 season (in 50 games), but Castellanos has a much longer track record. I’m also skeptical that Hernández will steal 11 bases this year when his career high is six and he’s been successful just 59 percent of the time in his career (17-for-29). I’d rather cast my line with Nick.
Lourdes Gurriel Jr.—86 ADP in 2021 (151 ADP in 2020)
Austin Meadows—85 ADP in 2021 (41 ADP in 2020)
595 PA, 77 R, 28 HR, 86 RBI, 8 SB, .274/.318/.482, .339wOBA—Gurriel (ATC projection)
578 PA, 78 R, 25 HR, 76 RBI, 11 SB, .259/.331/.476, .343 wOBA—Meadows (ATC projection)
My take: Gurriel has jumped from ADP 151 to 86, while Meadows has dropped from ADP 41 to 85. I like both players, but I like Meadows a little bit more.


