Overreacting to 2020—Fantasy Baseball Strategy for First Base
Baseball fans know that last season was the most unusual season of our lifetimes due to a global pandemic. There was the initial spring training, followed by a long layoff, then a second spring training. The season was shortened to 60 games, with teams only playing teams in the same region of the country. Rosters were expanded, double-headers featured seven inning games, there was a universal DH, and extra-innings started with a runner on second. Two teams, the Marlins and Cardinals, had significant off time because of Covid breakouts, which also affected the schedules of numerous other teams.
With that in mind, the consensus during the offseason has been that we should not put too much emphasis on a 60-game season played during a pandemic. Players who outperformed expectations did so in a two-month season, which led to three qualifying pitchers with ERAs under 2.00 (Shane Bieber, Trevor Bauer, Dallas Keuchel). That last time that happened was 1972. On the other hand, some very good hitters performed well below expectations over the two-month season, including Nolan Arenado, J.D. Martinez, and Jose Altuve.
The thing is, we’re human. As much as we tell ourselves not to overreact to the results of a two-month season, we can’t seem help it. We have more vivid memories of the 2020 season than 2019 and recency bias creeps in. Rookies who debuted and performed well above expectations are like the shiny new toy that we get on our birthday.
One way this manifests itself is in the fantasy baseball world, where players coming off terrific seasons are likely being drafted higher than they should be and players who slumped in 2020 are dropping too far on draft boards. To analyze this, we can compare a player’s average draft position (ADP) in 2021 to their ADP in previous years to determine who has risen up the ranks and who has fallen out of favor based in large part on last year’s shortened schedule.
I compiled ADP data from the National Fantasy Baseball Championships website based on drafts from March 1 through March 14. I then compared this year’s ADP to previous years and sorted by position to get an idea of how fantasy baseball owners are valuing players.
Note #1: I refer to Weighted On-Base Average (wOBA) below. It is a rate statistic that credits a hitter for the value of each outcome rather than treat all hits or times on base equally. It is on the same scale as On-Base Percentage (OBP) and is a better representation of offensive value than batting average, RBI, or OPS. I realize wOBA is not a fantasy baseball stat, but in general the top hitters in wOBA will be the top hitters in fantasy baseball, with the caveat that there are plenty of bad hitters who primarily provide value in fantasy baseball through stealing bases.
wOBA Scale:
- Excellent–.400 or above
- Great–.370
- Above Average–.340
- Average–.320
- Below Average–.310
- Poor–.300
- Awful–.290 or below
Note #2: I reference ATC projections below. These are composite projections created by Ariel T. Cohen using a “wisdom of the crowds” approach and are available at FanGraphs.
HELIUM GUYS
Ryan Mountcastle, Baltimore Orioles
- 2018 ADP: 749 (minor leagues)
- 2019 ADP: 720 (minor leagues)
- 2020 ADP: 467 (140 PA, .377 wOBA)
- 2021 ADP: 150
- ADP movement: up 317 spots
- 2021 ATC projection: 544 PA, 62 R, 20 HR, 73 RBI, 2 SB, .277/.320/.458, .331 wOBA
Mountcastle was a top-100 prospect at MLB Pipeline and Baseball Prospectus every year from 2018 to 2021. He made his debut last year and hit .333/.386/.492 in 140 plate appearances. His BABIP was also .398. Previously, he had BABIPs of .370 and .339 in the minor leagues in 2019 and 2018, respectively, so it’s not like he doesn’t hit the ball well. Still, that .398 BABIP last year isn’t likely to be repeated. Mountcastle’s Statcast metrics suggested a .266 xBA and .430 xSLG based on the way he hit the ball.
His ADP has skyrocketed because he was a long shot to play in the major leagues last year, so there was no reason to draft him (which sounds alot like an outfielder). Now he’s being drafted ahead of Eric Hosmer, Rhys Hoskins, and Trey Mancini, which I can’t get on board with after so few major league plate appearances.
Trey Mancini, Baltimore Orioles
- 2017 ADP: 693 (586 PA, .349 wOBA)
- 2018 ADP: 152 (636 PA, .308 wOBA)
- 2019 ADP: 235 (679 PA, .373 wOBA)
- 2020 ADP: 248 (DNP)
- 2021 ADP: 161
- ADP movement: up 87 spots
- 2021 ATC projection: 503 PA, 64 R, 22 HR, 66 RBI, 1 SB, .265/.330/.468, .341 wOBA
Mancini had his first full season in the big leagues in 2017, finishing third in the AL Rookie of the Year voting. He hit well enough that year to be roughly an 11th-round pick before the 2018 season (ADP 152). That season didn’t go so well (.242/.299/.416) and his ADP dropped to 235 heading into the 2019 season. He bounced back with a vengeance in 2019, hitting .291/.364/.535, with 106 runs, 35 homers, and 97 RBI. This impressive production would have sent his ADP soaring the following season, but life got in the way.
Mancini left the Orioles during spring training for what was reported as “a non-baseball medical procedure” on March 7. On the 12th, it was revealed that he had a malignant tumor removed from his colon. As the COVID-19 pandemic took over the country in March, MLB pushed back the start of the season. Mancini revealed he had stage 3 colon cancer in late April and his chemotherapy treatment would prevent him from playing baseball in 2020. He wrote about his experience getting treatment during a pandemic at The Players’ Tribune.
Now Mancini is back and looks healthy and everyone is rooting for him to be the player he once was. His ADP is 161, which isn’t far off from 2018 after his first good year in the major leagues. I’m rooting for him as much as anyone, but there have to be concerns about whether he can play 150 games like he did before missing last season. He’s projected for 503 plate appearances by ATC, but 567 plate appearances by the FanGraphs Depth Charts, which makes a big difference with the counting stats.
I’m mixed on Mancini’s surge up the ADP ranks. I think he will be a productive hitter, but I don’t expect 2019 again production-wise or playing time-wise considering he had 679 plate appearances that year. Whatever happens, I’m rooting for him.
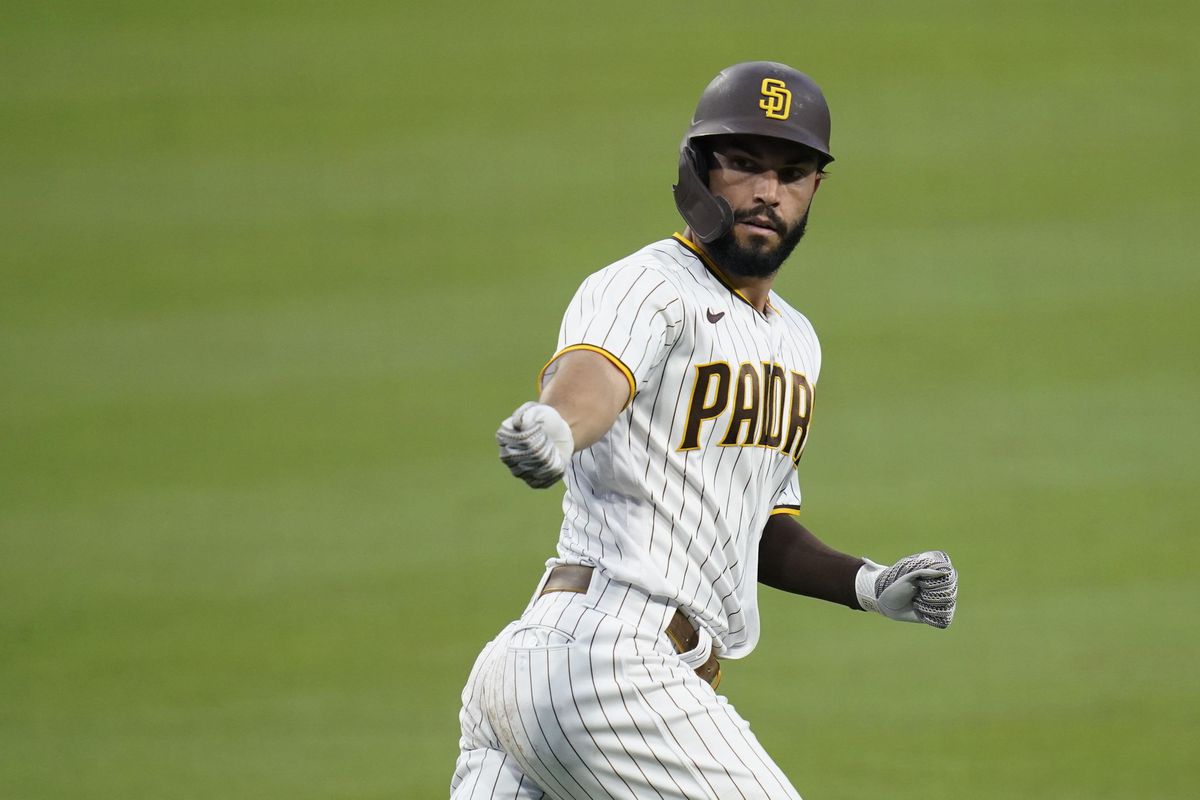
Eric Hosmer, San Diego Padres
- 2017 ADP: 107 (671 PA, .376 wOBA)
- 2018 ADP: 83 (677 PA, .309 wOBA
- 2019 ADP: 174 (667 PA, .309 wOBA)
- 2020 ADP: 231 (156 PA, .359 wOBA)
- 2021 ADP: 151
- ADP movement: up 80 spots
- 2021 ATC projection: 614 PA, 75 R, 22 HR, 87 RBI, 7 SB, .262/.318/.430, .319 wOBA
It’s hard to figure out who Eric Hosmer will be from season to season. His career year was 2017, which also happened to be his final season with his original team, the Kansas City Royals. He signed a long-term free-agent contract with the San Diego Padres coming off back-to-back 25-HR seasons with 104 and 94 RBI. His ADP heading into 2018 was 83, essentially a sixth-round pick.
Hosmer struggled in 2018 and 2019, with back-to-back seasons of below-average offense (.309 wOBA both years). The main criticism was a too-high ground ball rate that limited his ability to hit for power. In every season except his rookie year, Hosmer had hit ground balls more than 50 percent of the time, often in the 55 to 60 percent range.
In 2020, Hosmer improved his batted ball profile by dropping his ground ball rate to 46 percent and increasing his fly ball rate to a career-high 34 percent. This led to a career-best .517 slugging percentage and the second-best offensive season of his career (.359 wOBA). Of course, as we all know, the 2020 season was abbreviated to 60 games. What’s more, Hosmer only played in 38 games, so his good production last year came in less than one-fourth of the typical number of plate appearances he gets in a season.
Fantasy players are believers, though, as his ADP has moved from 231 to 151, up about six rounds. I’m skeptical because I don’t think he’ll come close to hitting the way he hit last year. Also, he’s struggled against left-handed pitchers throughout his career (.289 career wOBA vs. LHP, .352 career wOBA vs. RHP) and has been even worse against lefties recently. The Padres have enough quality players on the roster to sit Hosmer against some lefties should they so choose, which would cut into his playing time and reduce his counting stats.
ANVIL GUYS
Josh Bell, Washington Nationals
- 2017 ADP: 341 (620 PA, .338 wOBA)
- 2018 ADP: 188 (583 PA, .336 wOBA
- 2019 ADP: 252 (613 PA, .378 wOBA)
- 2020 ADP: 94 (223 PA, .286 wOBA)
- 2021 ADP: 145
- ADP movement: down 51 spots
- 2021 ATC projection: 592 PA, 79 R, 28 HR, 89 RBI, 1 SB, .260/.346/.483, .350 wOBA
Josh Bell had a breakout season in 2019 when he launched 37 homers and drove in 116 runs. Both were career-highs by a significant margin. That led to an ADP of 94 heading into the 2020 season. Instead of maintaining or building upon his 2019 season, Bell tanked in 2020. In 223 plate appearances, he had a career-low walk rate and career-high strikeout rate. He hit more ground balls than in any other season and his barrel percentage dropped from 12.7 percent in 2019 to 8.6 percent in 2020.
While Bell’s ADP has moved from 94 to 145, he’s still being drafted sooner than in any season before his breakout year. This suggests to me that fantasy players may be a little hesitant to draft Bell because of his ugly 2020 season, but they’re not all out on him. His ATC projection lands near the midway point of his career production from 2016 to 2018 and his breakout 2019 season. I’m on board with that.
Rhys Hoskins, Philadelphia Phillies
- 2017 ADP: 711 (212 PA, .417 wOBA)
- 2018 ADP: 50 (660 PA, .363 wOBA)
- 2019 ADP: 40 (705 PA, .347 wOBA)
- 2020 ADP: 117 (185 PA, .382 wOBA)
- 2021 ADP: 160
- ADP movement: down 43 spots
- 2021 ATC projection: 583 PA, 83 R, 30 HR, 84 RBI, 3 SB, .239/.362/.483, .363 wOBA
Hoskins’ 43-spot drop in ADP is not because he had a bad 2020 season. His .382 wOBA was the second-highest mark he’s had in his four-year career. It doesn’t come close to his incredible 50-game stint as a rookie (.259/.396/.618, 417 wOBA), but it was better than 2018 or 2019.
The issue with Hoskins is the surgery to repair a torn ligament in his left elbow he had in October. The procedure is not considered to be a full reconstruction, so his timeline was expected to be shorter than it would have been with Tommy John surgery (TJS). That’s good, because according to this article from 2019, of the 36 position players who had TJS and returned to the majors, the average recovery time was just over 11 months.
Hoskins’ 4-to-6-month recovery time seems to be working out as expected. He was “medically cleared” for all spring training activity in late February and has a dozen or so plate appearances in spring training games so far. I wouldn’t expect him to have the 650-700 plate appearances he had in 2018 and 2019, but around 600 seems reasonable. Of course, it would greatly benefit Hoskins and the Phillies if MLB would allow a universal DH this season.
Anthony Rizzo, Chicago Cubs
- 2018 ADP: 26 (665 PA, 359 wOBA
- 2019 ADP: 37 (613 PA, .390 wOBA)
- 2020 ADP: 68 (243 PA, .326 wOBA)
- 2021 ADP: 106
- ADP movement: down 38 spots
- 2021 ATC projection: 639 PA, 85 R, 26 HR, 85 RBI, 6 SB, .264/.366/.468, .355 wOBA
The last time Rizzo was being drafted later in the draft than this year was prior to the 2012 season, when he wasn’t yet expected to be a full-time player. He was a first-round pick for a three-year stretch in his prime from 2015 to 2017. He’s dropped a bit each year since his ADP peak in 2016 (10th overall), but never as much as this year’s 38-spot drop.
It’s an interesting development because Rizzo wasn’t that bad last year. At least, not Josh Bell bad or anything close. He still walked as much as ever and his strikeout rate was better than average. One contributing factor to his lackluster season was a significant drop in BABIP from the year before, going from .306 to .218. This contributed to his career-low .222 batting average, which was 43 points lower than his xBA at Statcast. Rizzo has essentially the same ADP as Alec Bohm, who has 180 career plate appearances. I think drafters should show more respect to the veteran.
This Guy or That Guy?
Let’s wrap-up this look at risers and fallers with a good, old-fashioned game of This Guy or That Guy for players with similar ADPs in 2021.
Josh Bell—145 ADP in 2021 (94 ADP in 2020)
Ryan Mountcastle—150 ADP in 2021 (467 ADP in 2020)
592 PA, 79 R, 28 HR, 89 RBI, 1 SB, .260/.346/.483, .350 wOBA—Bell (ATC projection)
544 PA, 62 R, 20 HR, 73 RBI, 2 SB, .277/.320/.458, .331 wOBA—Mountcastle (ATC projection)
My take: Bell is a veteran coming off a down season, while Mountcastle is the shiny, new toy. Bell has performed well over multiple full major league seasons, while Mountcastle has 140 career plate appearances with a hard-to-believe .398 BABIP. It may be boring, but I’ll take the veteran.
Eric Hosmer—150 ADP in 2021 (231 ADP in 2020)
Rhys Hoskins—158 ADP in 2021 (117 ADP in 2020)
614 PA, 75 R, 22 HR, 87 RBI, 7 SB, .262/.318/.430, .319 wOBA—Hosmer (ATC projection)
583 PA, 83 R, 30 HR, 84 RBI, 3 SB, .239/.362/.483, .363 wOBA—Hoskins (ATC projection)
My take: Hoskins has been a well-above average hitter every year of his career. Hosmer . . . has not. As long as Hoskins progresses with no major setbacks in spring training, I’m taking him over Hosmer every draft day of the week and twice on Sunday.
-Bobby Mueller


