In Defense of the 2022 Baseball
The talk of baseball so far this year is the baseball. Not the actual playing of baseball or the idea of baseball as an entertainment option or even the business of baseball, which was the talk of baseball during the offseason. No, it’s the actual baseball, the sphere-like object pitchers throw to catchers that batters do their best to hit with power and proficiency. This year’s baseball appears to be unlike baseballs from recent years, at least so far.
I’m here to defend the baseball we’ve seen in 2022. The ball’s getting a bad rap and I feel for the little fellow. Yes, offense is down. That’s obvious. But it’s not the ball that is solely to blame. One of the biggest criticisms of recent baseball is the increase in the three true outcomes, which are strikeouts, walks, and home runs. The more strikeouts, walks, and home runs there are, the fewer balls in play there are. Fewer balls in play mean fewer singles, doubles, and triples, as well as fewer spectacular plays on defense, which are all part of what makes baseball so fun to play and watch.
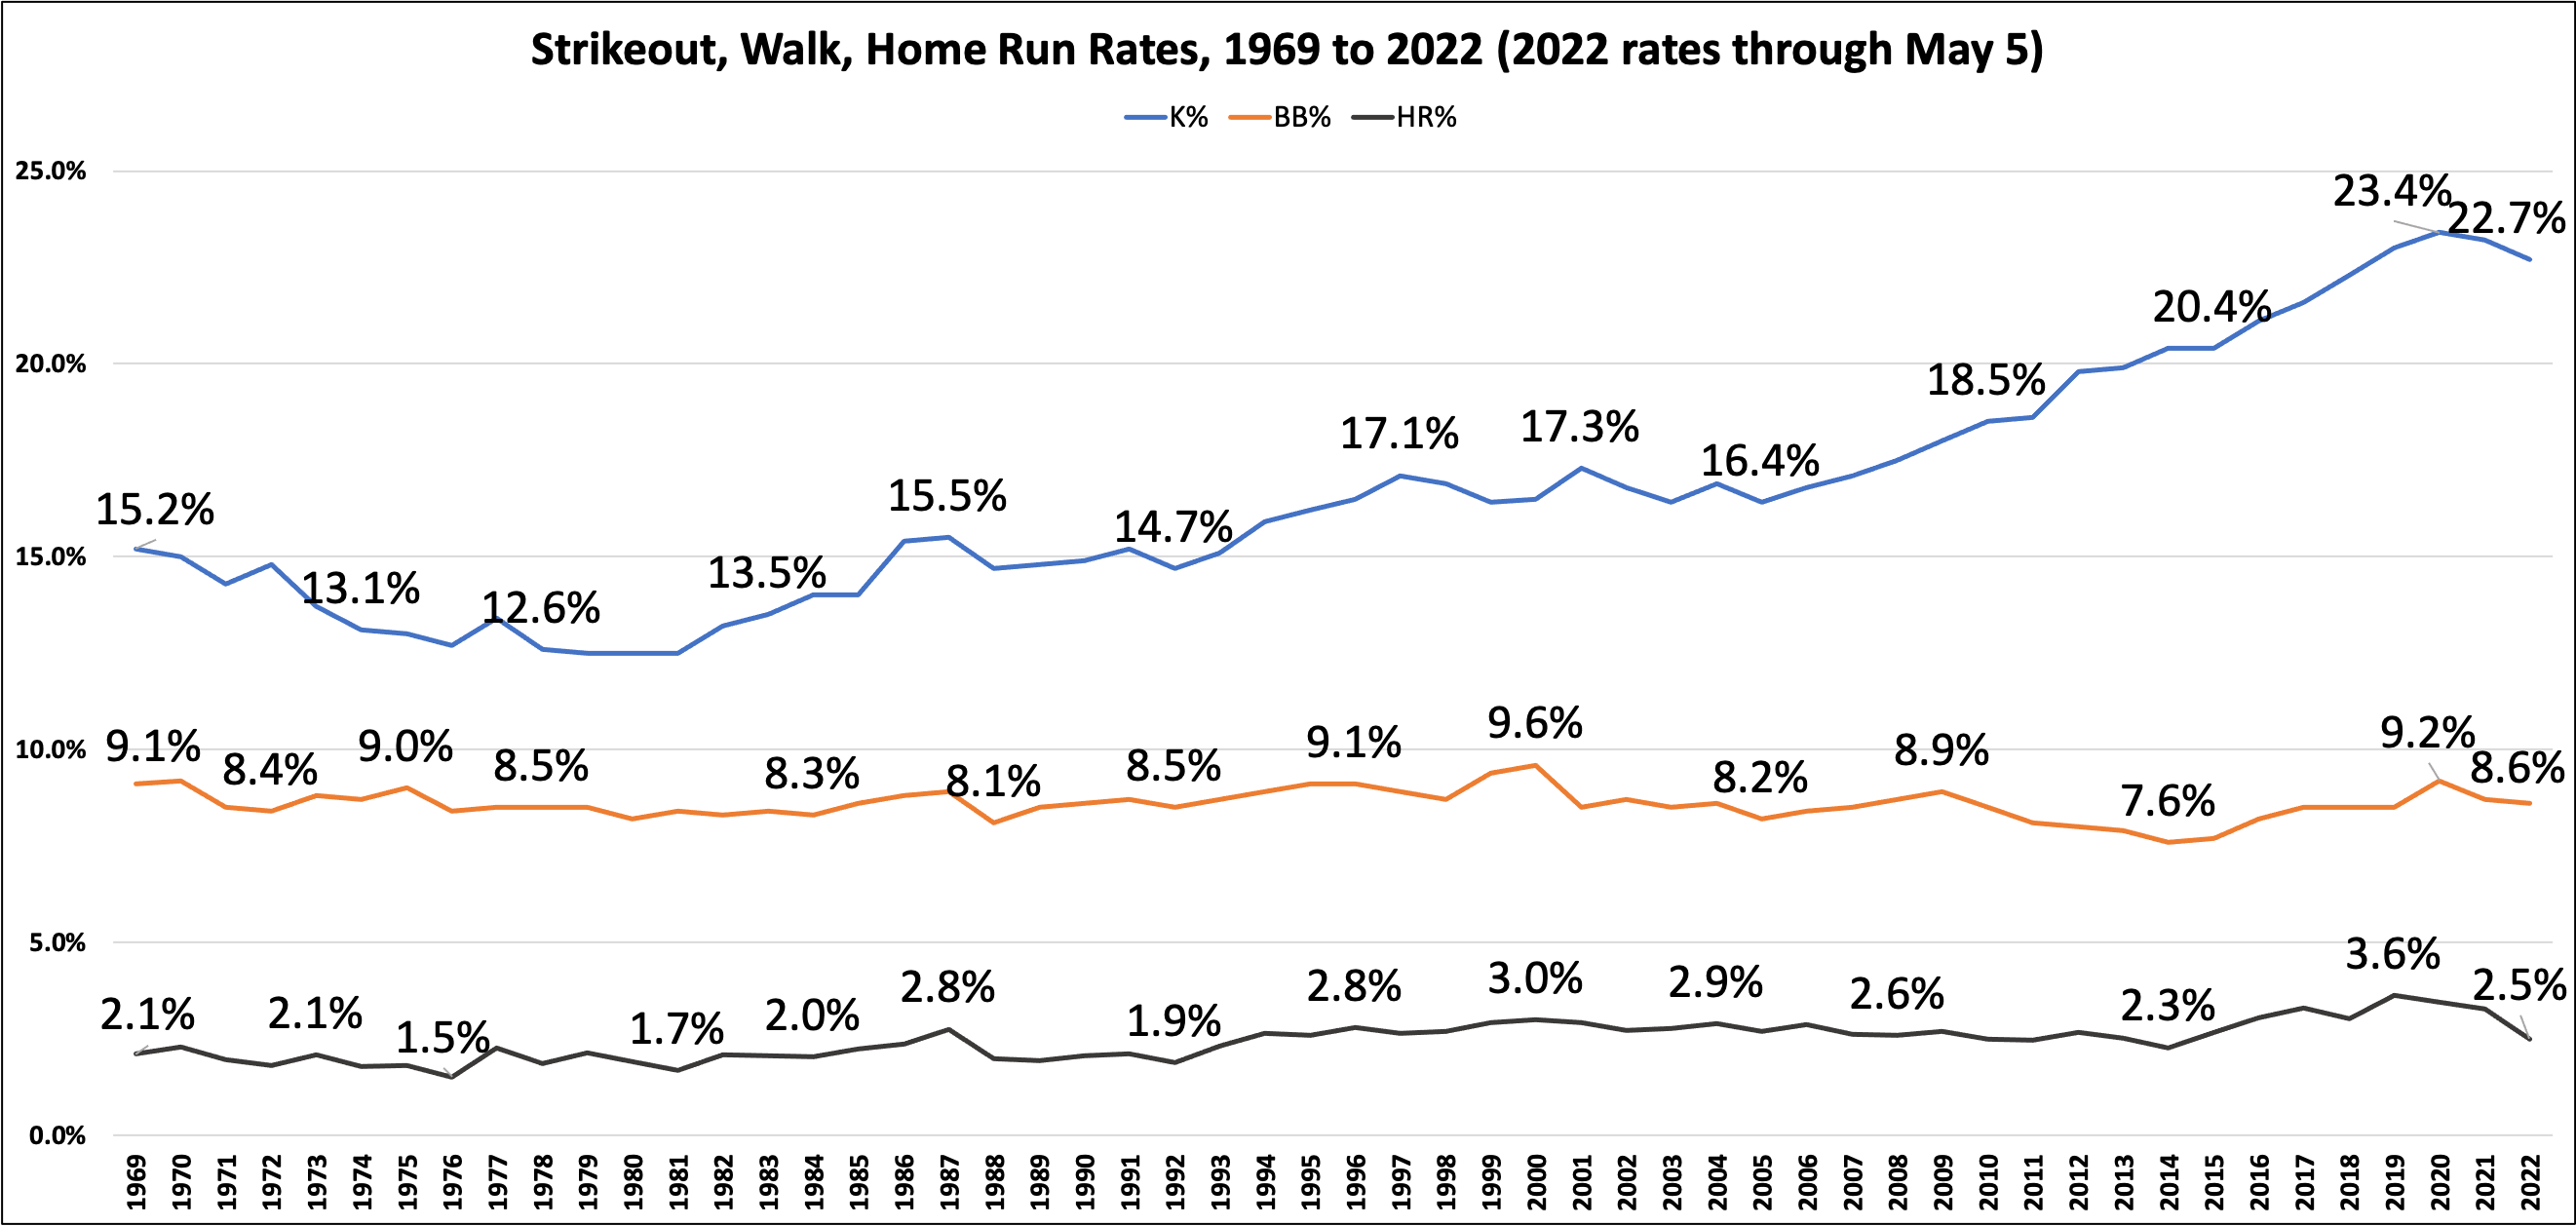
At the extreme, three true outcome baseball looks more like a home run derby than a baseball game. While home run derbies can be fun, they aren’t as fun as actual baseball. Here’s a chart of the strikeout rate, walk rate, and home run rate going back to 1969 (post-integration/start of divisional play). Selected years are labeled to make the graph easier to read.
It’s true that home runs are the most inconsistent of the three true outcomes. They go up, they come down, they have a major influence on the run environment and the aesthetics of the game. They are the easy culprit for disgruntled fans and analysts. If the three true outcomes were a rock and roll trio, home run rate would be the wildly inconsistent lead singer who is in and out of rehab and gets all of the attention, both positive and negative (walk rate would be the consistent and reliable drummer, while strikeout rate would be the hard-living guitarist who pushes the limits of heathenism and is increasingly difficult to reign in).
As you can see from the graph, walk rate has been relatively stable over the last 50-plus years. You can rely on walks. Since 1969, the median walk rate is 8.5 percent, with a range from 7.6 percent to 9.6 percent. In 2022, the walk rate is 8.6 percent through about a month’s worth of games. Reliable, dependent, consistent, that’s walk rate.
Strikeouts, as we all know, have persistently increased over the last 30 years or so. In 1969, batters struck out around 15 percent of the time. The K-rate fluctuated a bit over the next 25 years, dropping into the 12.5 percent range in the late-1970s and back up to the 15 percent range in the late 1980s and early 1990s. It jumped to 16.2 percent in 1995 and has persistently increased ever since, with a very recent decline over the last two seasons from the highest rate ever in 2020, at 23.4 percent, to a slight dip in 2021, at 23.2 percent, to this year’s rate of 22.7 percent (through May 5).
We’ll have to see how the rest of the season plays out, but that’s a good, if incremental, sign that we may be on the right track to a reduction of three true outcome baseball. So far this year, all three components are down from last season and the season before that.
As for this year’s “deadened” ball, it’s not as dead as you might think. To really focus in on the ball, we’ll use the metric home runs per balls in play (HR/BIP). This year’s baseball has resulted in a home run on 3.7 percent of balls hit into play (through May 5). That’s a lower HR/BIP than in any of the last seven seasons, six of which had rates of 4.4 percent or higher. This has led to fewer runs being scored, as you’d expect, and plenty of criticism of MLB.
If we take a step back and look at the bigger picture, though, we find that this year’s rate of HR/BIP would fit in quite nicely with the rate from the mid-1990s to the mid-2010s. For the 22-year stretch from 1994 to 2015, the rate of HR/BIP was 3.7 percent, which is an exact match for this year’s rate.
Context matters so much. For older baseball fans who watched baseball in the 1960s, 1970s, and 1980s, the increase in home run rate in the mid-1990s was a shocker. Over time, fans eventually grew accustomed to balls leaving the yard at a higher rate than in the past, even as the single-season home run record was broken multiple times and the career home run record was surpassed. In 2016, the rate shot up once again, reaching its apex with the 2019 season that some call the “happy, fun ball” year.
Now we’re back to the mid-1990s-to-mid-2010s ball and everyone is freaking out again, but for the opposite reason—there aren’t enough home runs. But really, this year’s ball is a return to the normalcy of most of the last 30 years. Historically speaking, it’s the six-year stretch from 2016 to 2021 that is the real outlier. If this year’s ball signifies the end of that inflated home run rate period, I saw, good job, 2022 ball!
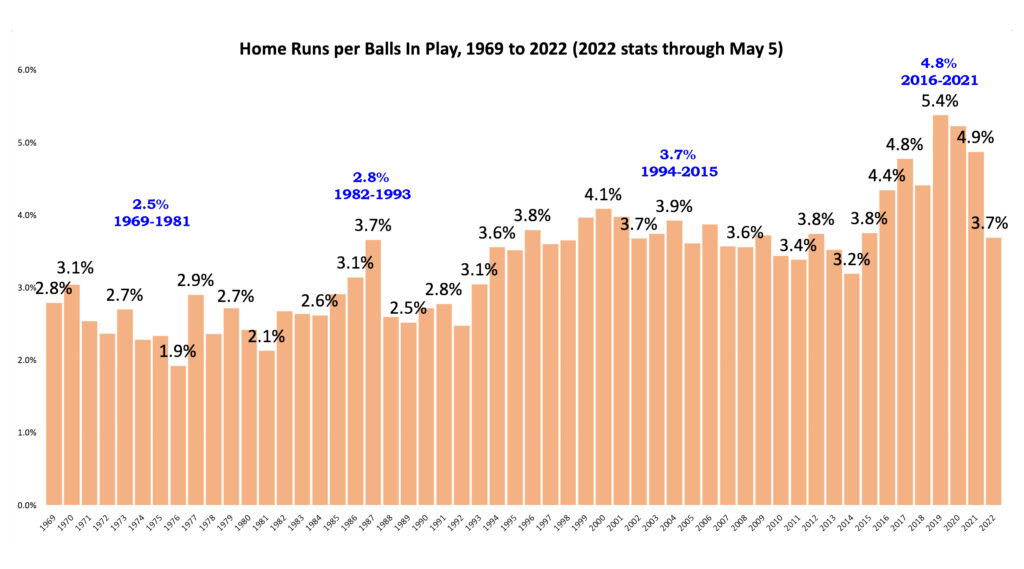
The graph above shows the trend in home runs per balls in play over time since 1969. From 1969 to 1981, the rate of home runs per balls in play was 2.5 percent. It increased a bit to 2.8 percent from 1982 to 1993, before taking a big jump in 1994. That was the start of a 3.7 percent HR/BIP rate over the next two decades. Then, from 2016 to 2021, the rate skyrocketed to 4.8 percent before drastically falling this year . . . to where it was before the big 2016 increase, which was where it was for more than two decades, which was still a fine time to be a baseball fan.
That means that for the typical Generation X MLB-watching fan, this year’s ball has produced a similar rate of home runs per balls in play as the games they were watching while wearing flannel and listening to grunge back in the mid-1990s. Even Millennial baseball fans have watched plenty of baseball games with a similar rate of HR/BIP as this year’s ball has produced. Maybe Gen-Zers are more used to the ball from the last half-dozen years, but I’m confident they’re flexible and can adjust to this year’s ball easily enough.
All that being said, it’s important to remember that it’s still early. The home run rate is likely to increase a bit as the temperatures rise. Humidors that may be reducing home runs in ballparks now could lead to more home runs later as the humidity changes in the spring and summer. We’re roughly one month through the season. To quote the great Joey Votto, “Five months to go. Enjoy the show.”

