Surprising Infielders With Similar Rest-of-Season Projections
As we reach the halfway point of the MLB season, there are players at every position having great years and others having very disappointing years. The best of the best are being voted into the All-Star game, while the rest will be getting a few days off next week. With roughly a half-season of games in the books, we know what a player has done and feel like we know what a player will do.
Humans are inherently fallible, though, and prone to bias. One very common bias that comes into play for baseball fans is recency bias, which is the tendency to overemphasize the importance of the latest information when estimating future events. In this case, the first half of the season is the most-recent information we have, so we are prone to being heavily influenced by those numbers.
With this in mind, I found a pair of players at each position who are currently having very different hitting seasons, but who also have very similar rest-of-season projections according to THE BAT X projections at FanGraphs. THE BAT X projections were created by Derek Carty. They incorporate an incredible amount of data, including statistics from past seasons and the current season, along with Statcast data like hard hit rate, exit velocity, and launch angle. An introduction to THE BAT X can be found at FanGraphs through this link.
For this article, hitting is all that matters. Defense is a separate issue. To compare each player’s offensive contributions, I’m using the metric wRC+ which stands for Weighted Runs Created Plus. This statistic is based on wOBA, which credits a hitter for the value of each outcome, such as singles, doubles, triples, homers, walks, and times hit by pitch. Basically, it takes into account what a player does in his time at the plate.
The cool thing about wRC+ is that it adjusts for ballpark effects and run environment so that league average each year is 100. It’s a more reasonable way to compare hitters who play half their games in hitter-friendly Coors Field with hitters who play half their games in a more pitcher-friendly park. Or to compare players from the high-offense 1930s with those who played in the low-offense 1960s. The important thing to remember is that 100 is league average. A wRC+ higher than 100 means that hitter is above average and lower than 100 is below average.
The chart below, courtesy FanGraphs, is a handy shortcut to understanding what is meant by a 115 wRC+ versus, say, a 90 wRC+. I’ve added players this year that correspond to each level.
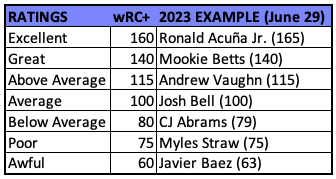
Mookie Betts has a 140 wRC+. This means he’s been 40 percent better than league average on offense. That’s worthy of a spot on the All-Star team. Javier Baez, on the other hand, has been awful. His 63 wRC+ means he’s been 37 percent worse than league average on offense. No All-Star game for him.
Each position pair below has an accompanying chart that shows the pre-season projections for the two players, their current statistics through June 29, and their rest-of-season projections from THE BAT X. In many cases, one of the two players was projected in the pre-season to be significantly better than the other but has had a terrible first half and the two projections are now essentially the same going forward. Most of these will be surprising and you’ll have your doubts for sure. I know I do. But at the end of the season, we’ll revisit this and see just how it all played out.
We’re covering infielders here, and we’ll cover the other positions in this other post on surprising outfielders and DH’s.
Catcher—Willson Contreras versus Sean Murphy
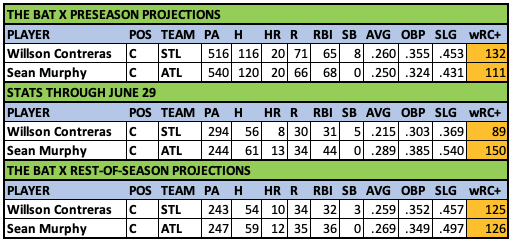
Willson Contreras signed a 5-year, $87.5 million free-agent contract with the St. Louis Cardinals in the offseason with the expectations that he would hit 20-25 homers, have an OBP around .350 and a slugging percentage around .450. He hasn’t come close to that kind of production in the first half and is in the midst of the worst hitting season of his career. He’s one of the reasons the Cardinals are having their worst season in recent memory.
Sean Murphy joined Atlanta as part of a three-team trade in which the primary pieces for each team were William Contreras (Willson’s younger brother) going from Atlanta to Milwaukee, Esteury Ruiz going from Milwaukee to Oakland, and Murphy going from Oakland to Atlanta. Murphy has been the best of the three, currently sporting a career-high 150 wRC+ and his 13 homers at the halfway point are just five short of the career-high 18 homers he hit last year.
Despite the current 61-point gap between Contreras (89 wRC+) and Murphy (150 wRC+), THE BAT X projections have Contreras with an almost identical wRC+ as Murphy from this point forward (125 to 126). Taking a closer look, Contreras’ batted ball metrics are very much in line with his typical season, but he’s just not getting the results you’d expect. He has a .263 expected batting average versus a .215 actual batting average and a .460 expected slugging versus a .369 actual slugging. THE BAT X is projecting that Contreras will get back to being the guy the Cardinals thought he was when they signed him last December.
As for Murphy, while he’s not expected to keep up his current 150 wRC+, his rest-of-season projected wRC+ is 15 points higher than it was in the pre-season. One outlier when looking at his numbers is his .338 batting average on balls in play (BABIP). He’s never had a BABIP higher than .290 before this year and his career BABIP is .286. If/when his BABIP regresses, his overall numbers will fall. We’ll have to check back in October to see how close Contreras and Murphy’s second-half numbers end up being.
First Base—Jose Abreu versus LaMonte Wade Jr.
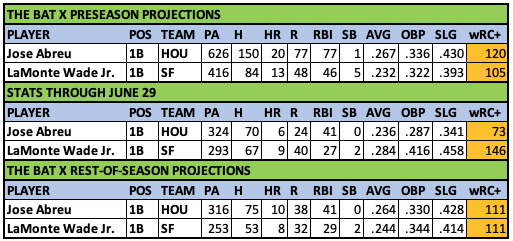
Jose Abreu signed a 3-year, $58.5 million contract with the Astros in the offseason and it has been a disaster so far. After nine seasons with the White Sox in which his wRC+ ranged from a low of 114 to a high of 167, Abreu has been well below average at the plate this season. Meanwhile, LaMonte Wade Jr. is having a career year for the Giants, with a wRC+ that is 30 points higher than his career mark and 53 points higher than last season, when he hit .207/.305/.359.
Despite the 73-point gap in wRC+ between Abreu and Wade, THE BAT X projects them to have the same wRC+ going forward. We’re already seeing a turnaround with Abreu. Since June 8, he’s hit .314/.333/.600, good for a wRC+ of 152. All five of his home runs this season has come in this recent 17-game stretch.
Wade is projected to slow down significantly, but it hasn’t happened yet. He’s been well above average offensively every month of the season. Walking 17.1 percent of the time is a big part of his game. That’s the third-highest walk rate among 154 qualifying hitters, behind Juan Soto and Ryan Noda and ahead of Andrew McCutchen and Will Smith.
Second Base—Miguel Vargas versus Luis Arraez
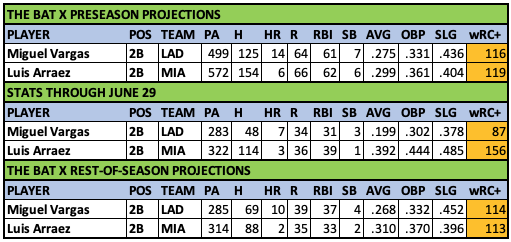
This is bound to make people angry. Miguel Vargas is below the Mendoza Line and Luis Arraez is trying to be the first .400 hitter since Ted Williams. Arraez’ batting average is almost double Vargas’ .199. How can they be compared?
It’s true, Luis Arraez is having an incredibly fun season as he reaches the halfway point with a batting average close to .400. He’s already had three 5-hit games, two 4-hit games, and six 3-hit games. People are writing about the possibility he actually hits .400 this year, which would be the most impressive .400 season ever when you consider the low league-wide batting average environment, the amount he’ll travel, the number of pitchers he’ll face, the advances in pitch design, the caliber of athletes in today’s game, and the expansion of the player pool to include non-white players, which wasn’t the case when Ted Williams hit .406 in 1941.
THE BAT X projections have no room for sentimentality. Just give it the data, please. Arraez is hitting .392, but his xBA (expected Batting Average) is just .337. His .405 BABIP is the second-highest in baseball among qualifying hitters, behind only Brandon Marsh’s .411. That will regress closer to his career .348 BABIP. His statcast numbers show a low Hard-Hit Percentage (23%) and few barrels (2.2%).
THE BAT X projects Arraez to hit .310 going forward, which is an increase over his projected .299 batting average in the pre-season. At the same time, his projected slugging percentage is lower than it was in the preseason. Based on whatever is under the hood in THE BAT X projections, Arraez has a lower rest-of-season projected wRC+ (113) than he had in the pre-season (119).
While THE BAT X projects Arraez to come crashing back to earth, the system projects Miguel Vargas to significantly pick up the pace by hitting for a much better batting average, on-base percentage, and slugging percentage than he has so far, so much so that he’s projected to be a slightly better overall hitter than Arraez from this point forward.
Third Base—Eugenio Suarez versus Isaac Paredes
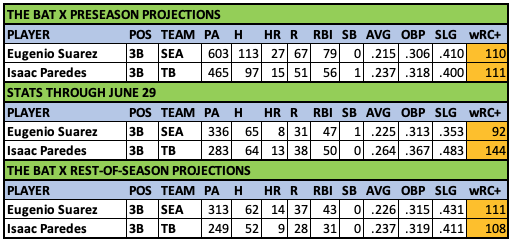
Eugenio Suarez and Isaac Paredes had very similar wRC+ projections in the pre-season (110 to 111). Suarez has struggled so far, particularly in the power department, while Paredes is one of a number of Tampa Bay Rays hitters having great seasons. Their current numbers suggest a massive difference between them, with Paredes’ wRC+ more than 50 points higher.
The expected stats for these players tell a different story.
Suarez:
- .225 BA, .233 xBA
- .353 SLG, .464 xSLG
- .296 wOBA, .342 xwOBA
Paredes:
- .264 BA, .218 xBA
- .483 SLG, .345 xSLG
- .370 wOBA, .305 xwOBA
It’s like a Freaky Friday situation, with Suarez’ actual stats looking very much like Paredes’ expected stats. THE BAT X projects both players will regress towards their expected stats from opposite directions and ultimately have a very similar wRC+ over the rest of the season.
Shortstop—Carlos Correa versus Bo Bichette
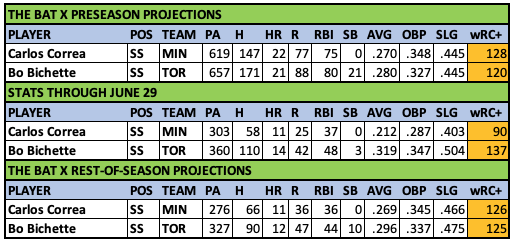
Coming into this season, Carlos Correa had a career 130 wRC+. At the midway point this year, his wRC+ is 90. Given that he’s only 28 years old, it’s not all that surprising that THE BAT X projects him to get back to being the hitter he was during the first eight years of his career versus the last few months.
It’s a similar story for Bo Bichette. He came into this season with a career 127 wRC+. At the midway point this year, he’s at 140. THE BAT X projects him to return to being the hitter he’s been during the first four years of his career.


