As we reach the halfway point of the MLB season, there are players at every position having great years and others having very disappointing years. The best of the best are being voted into the All-Star game, while the rest will be getting a few days off next week. With roughly a half-season of games in the books, we know what a player has done and feel like we know what a player will do.
Humans are inherently fallible, though, and prone to bias. One very common bias that comes into play for baseball fans is recency bias, which is the tendency to overemphasize the importance of the latest information when estimating future events. In this case, the first half of the season is the most-recent information we have, so we are prone to being heavily influenced by those numbers.
With this in mind, I found a pair of players at each position who are currently having very different hitting seasons, but who also have very similar rest-of-season projections according to THE BAT X projections at FanGraphs. THE BAT X projections were created by Derek Carty. They incorporate an incredible amount of data, including statistics from past seasons and the current season, along with Statcast data like hard hit rate, exit velocity, and launch angle. An introduction to THE BAT X can be found at FanGraphs through this link.
For this article, hitting is all that matters. Defense is a separate issue. To compare each player’s offensive contributions, I’m using the metric wRC+ which stands for Weighted Runs Created Plus. This statistic is based on wOBA, which credits a hitter for the value of each outcome, such as singles, doubles, triples, homers, walks, and times hit by pitch. Basically, it takes into account what a player does in his time at the plate.
The cool thing about wRC+ is that it adjusts for ballpark effects and run environment so that league average each year is 100. It’s a more reasonable way to compare hitters who play half their games in hitter-friendly Coors Field with hitters who play half their games in a more pitcher-friendly park. Or to compare players from the high-offense 1930s with those who played in the low-offense 1960s. The important thing to remember is that 100 is league average. A wRC+ higher than 100 means that hitter is above average and lower than 100 is below average.
The chart below, courtesy FanGraphs, is a handy shortcut to understanding what is meant by a 115 wRC+ versus, say, a 90 wRC+. I’ve added players this year that correspond to each level.
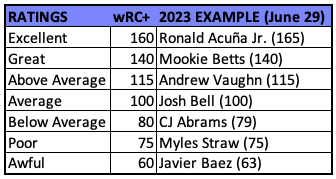
Mookie Betts has a 140 wRC+. This means he’s been 40 percent better than league average on offense. That’s worthy of a spot on the All-Star team. Javier Baez, on the other hand, has been awful. His 63 wRC+ means he’s been 37 percent worse than league average on offense. No All-Star game for him.
Each position pair below has an accompanying chart that shows the pre-season projections for the two players, their current statistics through June 29, and their rest-of-season projections from THE BAT X. In many cases, one of the two players was projected in the pre-season to be significantly better than the other but has had a terrible first half and the two projections are now essentially the same going forward. Most of these will be surprising and you’ll have your doubts for sure. I know I do. But at the end of the season, we’ll revisit this and see just how it all played out.
We’re covering surprising outfielders and DH’s here, and we covered the other positions in this other post on surprising infielders.
Left Field—Taylor Ward versus Corbin Carroll

It wasn’t until his fourth season in the major leagues that Taylor Ward was an above average hitter. That was two years ago when he had a 110 wRC+ in 65 games. Last year, he broke out with a .281/.360/.473 season and even that was a roller-coaster ride, as he was incredible in April and May (221 wRC+), dreadful in June, July, and August (78 wRC+), then very good again in September and October (174 wRC+).
Ward got off to a slow start this year and was hitting .220/.295/.312 (69 wRC+) through May 28. He’s upped his game since then, hitting .278/.345/.495 (129 wRC+) and THE BAT X projects he’ll continue to hit like he has over the last month rather than how he hit before then.
Corbin Carroll is running away with the NL Rookie of the Year Award and behind only Ronald Acuña Jr. in the race for the NL MVP Award. With 17 homers and 24 steals around the mid-point of the season, he has a chance for a 30-HR/50-SB season, which has only happened twice in MLB history. Those two times were accomplished within four years of each other when Eric Davis hit 37 homers and stole 50 bases in 1987 and Barry Bonds hit 33 dingers and stole 52 bags in 1990.
Despite his great half-season, Carroll is projected to hit slightly worse than Taylor Ward from this point forward. Specifically, THE BAT X projects Carroll to regress in slugging percentage and batting average, which would also reduce his on-base percentage. One reason behind the regression is Carroll’s Statcast data that show a .257 expected batting average versus his actual .290 average and a .449 expected slugging percentage versus his actual .559 slugging percentage.
Center Field—Michael A. Taylor versus Jose Siri
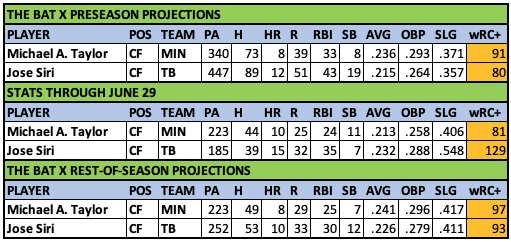
Michael A. Taylor and Jose Siri were both projected to be below-average hitters coming into the season. They’ve been particularly bad at getting on base throughout their careers. Both have continued to be bad at getting on base, but have hit with more power than expected, particularly so in the case of Jose Siri and his 15 homers and .548 slugging percentage.
THE BAT X must not believe in the Tampa Bay Rays devil magic because it isn’t buying what Jose Siri is selling. The system has upped his pre-season projection from an 80 wRC+ to a 93 wRC+ going forward, which is a nice jump that takes into account how well he’s hit so far. Still, that’s slightly below Michael A. Taylor’s projected 97 wRC+, which would be his best since 2017. It’s not clear what the system sees with Taylor. He hasn’t had a wOBA over .300 since 2017, yet THE BAT X projects him to have a .309 wOBA from here on out. Very peculiar.
Right Field—Starling Marte versus Lane Thomas
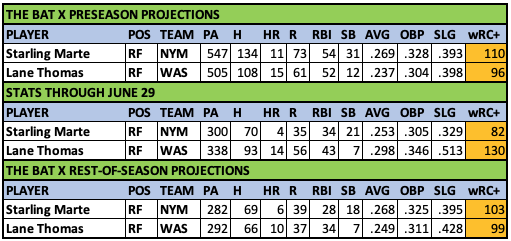
Starling Marte is one of the many problems with the 2023 New York Mets. After years of above-average offensive production, Marte is having the worst season of his career. His on-base percentage is slightly above .300, versus a career .343 OBP, and his slugging percentage has fallen into an abyss at .329, well short of his .446 career mark. The main thing he’s still doing well is stealing bases, with 21 at the halfway point of the season. Despite it all, THE BAT X projects him to hit closer to his pre-season projection over the rest of the season than what he’s done so far.
Lane Thomas is on a very short list of Washington Nationals players who have a chance to be the team’s lone representative at the All-Star Game in Seattle this year (before he gets traded to a contender in late July). He didn’t make the first cut, even though he leads the team in home runs, runs scored, RBI, and wRC+. THE BAT X isn’t buying in, though, projecting Thomas with a league average 99 wRC+ from this point on, which is just slightly higher than his pre-season projection. Basically, THE BAT X believes Lane Thomas is who they thought he was.
Designated Hitter—Byron Buxton versus J.D. Martinez

Byron Buxton has been roughly a league average hitter through the first half of this season, but since the start of the 2021 season, he has a 136 wRC+. THE BAT X projects him to have a 132 wRC+ going forward, so the system hasn’t been swayed much by Buxton’s first-half mediocrity.
It’s a similar story for J.D. Martinez, who has a 124 wRC+ since the start of the 2021 season. He’s been a bit better than that in the first half of this year and THE BAT X expects that to continue, but not at the level of Buxton.
Bonus Battle—Mike Trout versus Shohei Ohtani
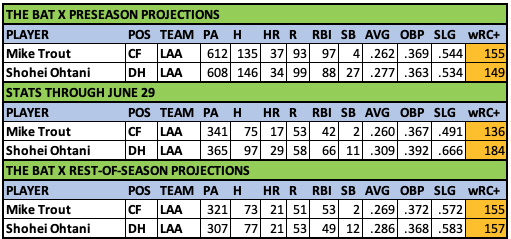
For a typical player, a 136 wRC+ through 81 games is a very good first half, often times worth of a spot on the All-Star team. For Mike Trout, it’s a three-month slump, and merely his 10th straight fan-selected start. Before this year, he’s never had a full season with a wRC+ below 160 or a slugging percentage below .500, yet here he is.
Trout’s most well-known teammate, Shohei Ohtani, has been a good hitter in his career, but he’s taken it to a whole new level this year. His 29 homers and 184 wRC+ lead all qualifying hitters (editor’s note: Ohtani is up to 31 homers, and may very well hit another before this gets published). He was particularly en fuego in June, with a .392/.484/.931 batting line. That’s a 273 wRC+.
THE BAT X has taken all this into account and concluded that, over the remainder of the season, Mike Trout and Shohei Ohtani will be roughly equal offensively. Ohtani has ascended to Trout’s level on offense. It remains to be seen whether that would be enough to get the Angels into the postseason for the first time since 2014.


