Overreacting to 2020—Fantasy Baseball Strategies at Shortstop
Baseball fans know that last season was the most unusual season of our lifetimes due to a global pandemic. There was the initial spring training, followed by a long layoff, then a second spring training. The season was shortened to 60 games, with teams only playing teams in the same region of the country. Rosters were expanded, double-headers featured seven inning games, there was a universal DH, and extra-innings started with a runner on second. Two teams, the Marlins and Cardinals, had significant off time because of Covid breakouts, which also affected the schedules of numerous other teams.
With that in mind, the consensus during the offseason has been that we should not put too much emphasis on a 60-game season played during a pandemic. Players who outperformed expectations did so in a two-month season, which led to three qualifying pitchers with ERAs under 2.00 (Shane Bieber, Trevor Bauer, Dallas Keuchel). That last time that happened was 1972. On the other hand, some very good hitters performed well below expectations over the two-month season, including Nolan Arenado, J.D. Martinez, and Jose Altuve.
The thing is, we’re human. As much as we tell ourselves not to overreact to the results of a two-month season, we can’t seem help it. We have more vivid memories of the 2020 season than 2019 and recency bias creeps in. Rookies who debuted and performed well above expectations are like the shiny new toy that we get on our birthday.
One way this manifests itself is in the fantasy baseball world, where players coming off terrific seasons are likely being drafted higher than they should be and players who slumped in 2020 are dropping too far on draft boards. To analyze this, we can compare a player’s average draft position (ADP) in 2021 to their ADP in previous years to determine who has risen up the ranks and who has fallen out of favor based in large part on last year’s shortened schedule.
I compiled ADP data from the National Fantasy Baseball Championships website based on drafts from March 1 through March 14. I then compared this year’s ADP to previous years and sorted by position to get an idea of how fantasy baseball owners are valuing players.
Today, we’re covering shortstops. You can catch the other articles at the links below:
wOBA Scale:
- Excellent–.400 or above
- Great–.370
- Above Average–.340
- Average–.320
- Below Average–.310
- Poor–.300
- Awful–.290 or below
HELIUM SHORTSTOPS
Dansby Swanson, Atlanta Braves
- 2016 ADP: 732 (145 PA, .334 wOBA)
- 2017 ADP: 187 (551 PA, .276 wOBA)
- 2018 ADP: 524 (533 PA, .293 wOBA)
- 2019 ADP: 486 (545 PA, .317 wOBA)
- 2020 ADP: 236 (264 PA, .348 wOBA)
- 2021 ADP: 107
- ADP movement: up 129 spots
- 2021 ATC projection: 630 PA, 91 R, 23 HR, 77 RBI, 12 SB, .256/.327/.440, .324 wOBA
Swanson’s first big dose of helium came after he debuted in 2016 with a .302/.361/.442 batting line in 38 games as a shortstop. His ADP the following spring was 187, making him the 10th shortstop off the board. The helium went out of his balloon after a terrible 2017 season, then remain deflated following a bad 2018 season. He improved in 2019, which moved his ADP up to 236, then followed that up with a hot stretch of 264 plate appearances in 2020. He now has the highest ADP of his career, at 107, 13 spots ahead of Carlos Correa, who has a career wOBA that’s 49 points higher than Swanson.
Swanson’s two above-average offensive seasons were his 38-game rookie year, when he had a .383 BABIP, and his 60-game 2002 season, when he had a .350 BABIP. In the three seasons in between, he hit a combined .240/.314/.380 in 1,629 plate appearances.
Most of the projections at FanGraphs have Swanson hitting about as well as he hit in 2019, but with around 640 plate appearances. His career high in games played is 144 and in plate appearances is 551, but he played every game of the 2020 season and his 264 plate appearances in 60 games pro-rate to 712 in a 162-game season. I believe a big part of his jump in ADP is his projection for 80-90 more plate appearances than he’s ever had in a season, plus the results of his career-best 2020 season that came in a small sample size. I don’t think it’s a good bet to draft a player based on an expectation of setting a career high in playing time by that much.
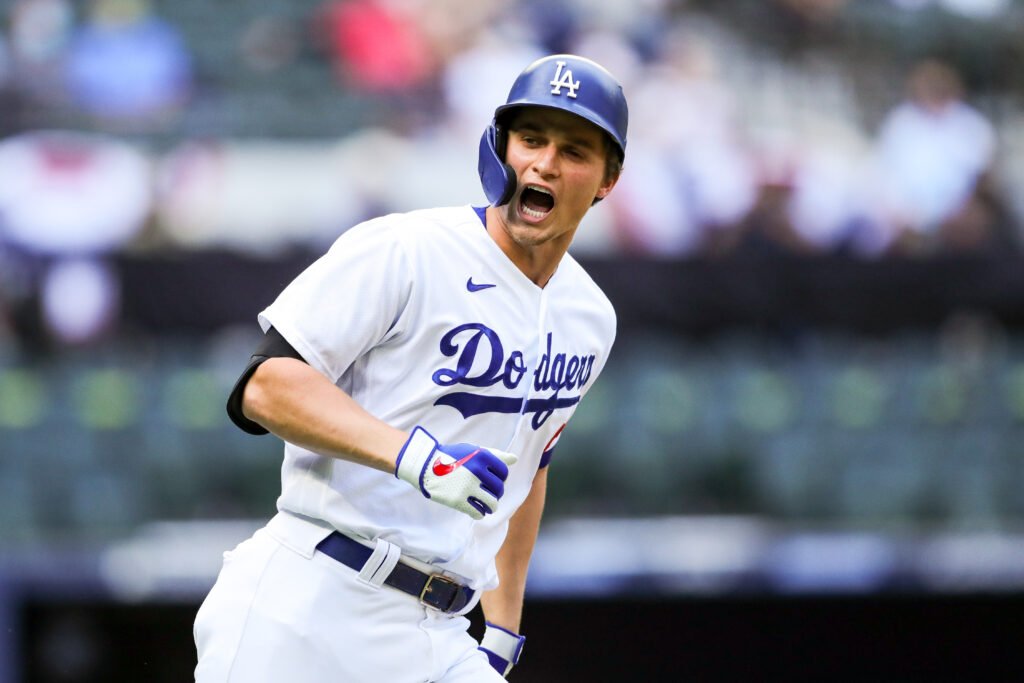
Corey Seager, Los Angeles Dodgers
- 2016 ADP: 60 (687 PA, .372 wOBA)
- 2017 ADP: 22 (613 PA, .364 wOBA)
- 2018 ADP: 44 (115 PA, .324 wOBA)
- 2019 ADP: 88 (541 PA, .340 wOBA)
- 2020 ADP: 140 (232 PA, .394 wOBA)
- 2021 ADP: 33
- ADP movement: up 107 spots
- 2021 ATC projection: 608 PA, 94 R, 29 HR, 97 RBI, 3 SB, .290/.354/.524, .369 wOBA
Corey Seager was a very good hitter in his first two full seasons (2016 and 2017) before his injury-shortened third season that led to Tommy John surgery. He played in 134 games in 2019 and was good, but was not really back at his previous level. Perhaps he was still recovering from the injury or maybe the time off played a factor.
He was as good as ever last year, with a .394 wOBA in 52 games that was actually below his .427 xwOBA. His 2020 Statcast page is full of red ink, as he finished in the 95th percentile or above in Exit Velocity, Hard Hit percentage, xBA, xSLG, and Barrel percentage. It’s everything you want to see in a hitter, let alone one who mans a premium defensive position like shortstop. I believe his surge in ADP is justified. The one caveat I have with Seager is his projected playing time. ATC has him with 608 PA, which I believe is reasonable, but the other sources at FanGraphs are projecting 640-670. He’s only had one season in which he had more than 615 plate appearances and the Dodgers have plenty of talented players to give playing time to.
Tim Anderson, Chicago White Sox
- 2016 ADP: 628 (431 PA, .315 wOBA)
- 2017 ADP: 156 (606 pa, .288 wOBA)
- 2018 ADP: 197 (606 PA, .294 wOBA)
- 2019 ADP: 132 (518 PA, .363 wOBA)
- 2020 ADP: 96 (221 PA, .376 wOBA)
- 2021 ADP: 42
- ADP movement: up 54 spots
- 2021 ATC projection: 628 PA, 95 R, 22 HR, 69 RBI, 17 SB, .289/.322/.464, .335 wOBA
Tim Anderson made his debut in 2016 with a .283/.306/.432 season that was at least in part fueled by a .375 BABIP. His xBA that year, per Statcast, was .249, 34 points lower than his actual batting average. He came back down to earth over the ensuing two seasons, with well below average offensive production. Overall, in his first three seasons, he hit .258/.286/.411, with a .326 BABIP in 1,643 plate appearances.
Then came a breakout 2019 season (.335/.357/.508) and a similar 2020 season (.322/.357/.529), with BABIPs over .380 both years. Fantasy baseball players bumped him up 36 spots after the 2019 season and another 54 spots after 2020. They seem to be buying what he’s selling, but can he keep this up? I’m skeptical.
Anderson has outhit his batted ball data every year of his career. His lifetime batting average is .281, while his xBA is .254, and he’s slugged .443 with an xSLG of .404. He’s slated for the leadoff spot in new manager Tony La Russa’s lineup, which is a nice place to hit in a good White Sox lineup, but I have a hard time believing he can continue to do what he’s been doing. Just because a coin flip comes up heads five times in a row doesn’t mean it will keep coming up heads.
ANVIL GUYS
Gleyber Torres, New York Yankees
- 2018 ADP: 374 (484 PA, .349 wOBA)
- 2019 ADP: 64 (604 PA, .358 wOBA)
- 2020 ADP: 29 (160 PA, .326 wOBA)
- 2021 ADP: 65
- ADP movement: down 36 spots
- 2021 ATC projection: 601 PA, 80 R, 29 HR, 83 RBI, 6 SB, .267/.345/.486, .354 wOBA
Torres had a nice rookie year in 2018 when he hit 24 homers in 484 plate appearances, made the AL All-Star team, and finished third in AL Rookie of the Year voting. Fantasy baseball players bumped him up to an ADP of 64, which made him the eighth shortstop in the queue. He was even better in his second season, hitting 38 dingers, scoring 96 runs and driving in 90, and his ADP jumped to 29, fourth among shortstop.
Last year, Torres was good in July (6 games, .347 wOBA), awful in August (18 games, .274 wOBA), and good again in September (18 games, .366 wOBA) after missing a couple weeks with an injury. In the short season, his IL stint and struggles in August dragged his overall statistics down, but he’s still projected for a 30-ish HR, 80-plus RBI season in 2021. I don’t think he deserves to drop 36 spots in ADP based on 2020.
Javier Báez, Chicago Cubs
- 2017 ADP: 124 (508 PA, .326 wOBA)
- 2018 ADP: 105 (645 PA, .366 wOBA)
- 2019 ADP: 16 (561 PA, .347 wOBA)
- 2020 ADP: 36 (235 PA, .256 wOBA)
- 2021 ADP: 71
- ADP movement: down 35 spots
- 2021 ATC projection: 628 PA, 82 R, 27 HR, 87 RBI, 11 SB, .259/.298/.463, .317 wOBA
Javier Báez had his breakout season in 2018 when he set career-highs in hits, runs, homers, RBI, steals, batting average, on-base percentage, slugging percentage, and wOBA. His 34-HR/21-SB combination was especially appealing to fantasy players looking for their shortstop to do everything. The following spring, his ADP jumped 99 spots to 16, which is just outside the first round. He had another good season in 2019, but not nearly as good as 2018 and dropped 20 spots coming into the 2020 season.
Báez has never had good plate discipline, but his 2020 season was worse than ever. He struck out nearly 32 percent of the time and walked just 3 percent of the time on the way to the worst “full” season of his career. His batted ball data was middling. He was in the 51st percentile in Barrell rate and 55th percentile in Hard Hit rate, but just 7th percentile in xwOBA. He also had the lowest BABIP of his career at .262, 73 points below his career mark.
Now his ADP has moved from 36 to 71 and I have to wonder if that’s a big enough drop. Outside of his 2018 season, Báez’ career high in steals is 12 and he had just three stolen base last year in 59 games. He’s also being projected for 630-670 plate appearances by the multiple sources at FanGraphs even though he’s only exceeded 570 plate appearances in a season once in his career. I’m out on Báez even at his reduced price.
This Guy or That Guy?
Let’s wrap-up this look at risers and fallers with a good, old-fashioned game of This Guy or That Guy for players with similar ADPs in 2021.
Gleyber Torres—65 ADP in 2021 (29 ADP in 2020)
Javier Báez—71 ADP in 2021 (36 ADP in 2020)
601 PA, 80 R, 29 HR, 83 RBI, 6 SB, .267/.345/.486, .354 wOBA—Torres (ATC projection)
628 PA, 82 R, 27 HR, 87 RBI, 11 SB, .259/.298/.463, .317 wOBA—Báez (ATC projection)
My take: The projections are close, with steals favoring Báez, but I don’t believe he’ll steal as much or play as much as he’s expected to, so I would take Torres and not look back.
Corey Seager—33 ADP in 2021 (140 ADP in 2020)
Xander Bogaerts—34 ADP in 2021 (38 ADP in 2020)
608 PA, 94 R, 29 HR, 97 RBI, 3 SB, .290/.354/.524, .369 wOBA—Seager (ATC projection)
631 PA, 94 R, 28 HR, 91 RBI, 12 SB, .288/.360/.506, .365 wOBA—Bogaerts (ATC projection)
My take: You can’t go wrong with either player here, but I would take Bogaerts based on his ability to steal bases and likelihood of getting more playing time. The Dodgers have so much talent on their roster that they don’t need to have their regulars play 150-plus games each year. The Red Sox, like most teams in baseball, do not have that luxury.
Note #1: I refer to Weighted On-Base Average (wOBA) below. It is a rate statistic that credits a hitter for the value of each outcome rather than treat all hits or times on base equally. It is on the same scale as On-Base Percentage (OBP) and is a better representation of offensive value than batting average, RBI, or OPS. I realize wOBA is not a fantasy baseball stat, but in general the top hitters in wOBA will be the top hitters in fantasy baseball, with the caveat that there are plenty of bad hitters who primarily provide value in fantasy baseball through stealing bases.
Note #2: I reference ATC projections below. These are composite projections created by Ariel T. Cohen using a “wisdom of the crowds” approach and are available at FanGraphs.

